Most new dropshippers make nothing in their first three to six months. Plenty lose a few thousand dollars on ads and quit. The stores that stick around usually net 5% to 15% of revenue. At $10,000 a month in sales, that’s $500 to $1,500 in your pocket. At $50,000, it’s $5,000 to $7,500. Anyone promising a steady 30% net on a general store is probably selling a course.
Below you’ll find three full profit-and-loss statements, the ad funnel math (CTR, conversion rate, CPA), a look at ad channels beyond Meta and TikTok, how much cash payment processors can lock up as you grow, break-even formulas, and a quick checklist for vetting a product before you spend a dollar on ads.
One thing up front: every number here comes from a single unit-economics model, not a survey. You can rerun it with your own inputs, which is more useful than a stat nobody can trace. Fees and policies on Shopify, Amazon, eBay, and TikTok Shop change often, so check current rates before you plan around them.
Start with one product and one set of numbers
Every example in this article uses the same product, so nothing contradicts anything else.
| Input | Value |
|---|---|
| Selling price (also your AOV, average order value, for a single item) | $40 |
| Product cost + supplier shipping | $18 |
| Payment processing (2.9% + $0.30) | $1.46 |
| Refunds, chargebacks, replacements | 6% of revenue ($2.40) |
| Cost per purchase from Meta or TikTok ads (CPA) | $13 to $15 |
| Sales tax | Ignored. You collect it from the customer and pass it to the state. It isn’t your expense. |
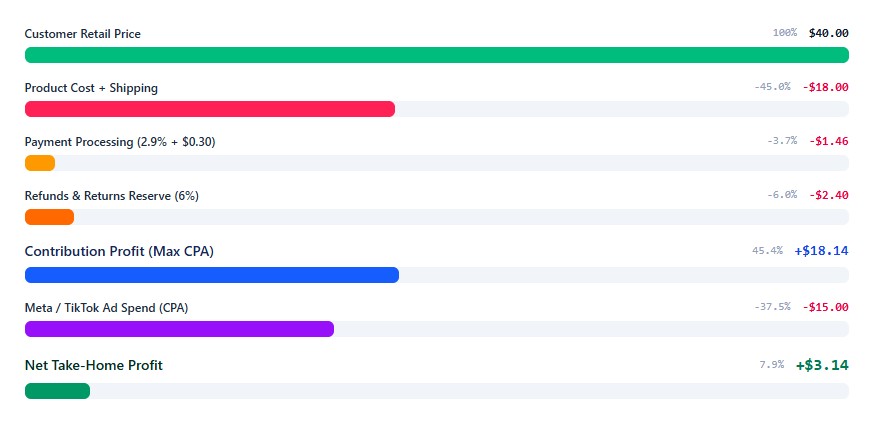
Add up the costs before ads: $18 + $1.46 + $2.40 = $21.86. That leaves $18.14 per order to cover ads, software, and your own paycheck. Call it contribution profit. The whole business comes down to one question: does your ad cost per sale come in under that number?
Know what revenue actually turns into
Here’s what you keep at different sizes, before your own income tax.
| Monthly revenue | 5% net | 10% net | 15% net |
|---|---|---|---|
| $5,000 | $250 | $500 | $750 |
| $10,000 | $500 | $1,000 | $1,500 |
| $25,000 | $1,250 | $2,500 | $3,750 |
| $50,000 | $2,500 | $5,000 | $7,500 |
| $100,000 | $5,000 | $10,000 | $15,000 |
Look at the $50,000 row. To pay yourself $5,000 a month at a 10% margin, you need $50,000 in monthly sales. That’s 1,250 orders at $40. A lot of “dropshipping income” articles mix up margin and revenue right here, and it’s the reason their numbers look so friendly.
Then there’s tax. In the U.S., you’ll owe self-employment tax (15.3% on most of your net profit) plus federal and state income tax. Setting aside 25% to 30% of profit is a safe starting point. Your accountant will fine-tune it.
See three real P&Ls side by side
Same $40 product at three sizes. Costs shift as you grow. Supplier pricing improves and refunds drop a bit as you tighten up, but ad costs creep up and you have to pay for help.
| $10K month | $50K month | $100K month | |
|---|---|---|---|
| Orders | 250 | 1,250 | 2,500 |
| Product + supplier shipping | $4,500 | $20,625 | $38,750 |
| Payment fees | $365 | $1,825 | $3,650 |
| Refunds & chargebacks (6% / 5% / 5%) | $600 | $2,500 | $5,000 |
| Ads (CPA: $15 / $14 / $15) | $3,750 | $17,500 | $37,500 |
| Tools, support, accounting | $200 | $1,400 | $3,000 |
| Net profit | $585 | $6,150 | $12,100 |
| Net margin | 5.9% | 12.3% | 12.1% |
| MER (revenue ÷ total ad spend) | 2.67 | 2.86 | 2.67 |
Three things jump out.
Margin stops improving around $50K. Better supplier pricing gets eaten by higher ad costs and the support help you now have to hire. Past that point, more profit mostly comes from more volume.
The $10K store is basically a hobby. $585 for roughly 100 hours of work is about $6 an hour. This is where most people quit. It’s also where the real learning happens, so it’s worth knowing going in.
One dollar of CPA moves everything. At $50K, a $1 higher CPA costs you $1,250 a month, about 20% of your profit. So where does CPA come from?
Break the ad funnel into four numbers
Your ad dashboard shows CPM (cost per 1,000 impressions), CTR (click-through rate), CPC (cost per click), and CR (the store’s conversion rate). CPA is just what falls out of them.
CPC = CPM ÷ (1,000 × CTR)
CPA = CPC ÷ CR
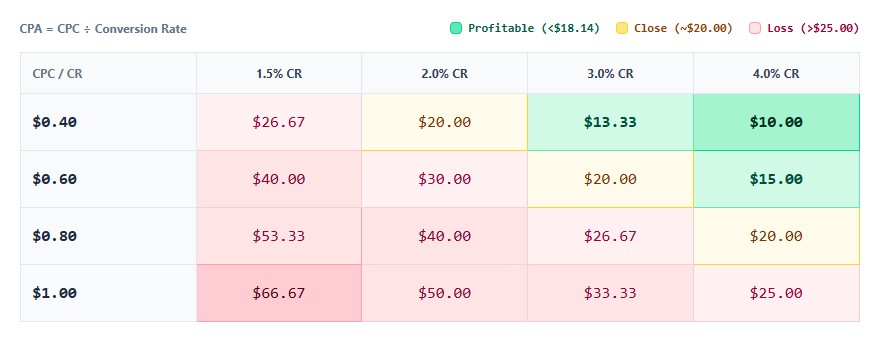
Take a decent cold-traffic setup on Meta or TikTok: a $10 CPM, 2% CTR, and a 3% conversion rate. CPC works out to $0.50, and CPA is $0.50 ÷ 0.03 = $16.67. That’s already uncomfortably close to our $18.14 break-even.
| CPC | CR 1.5% | CR 2% | CR 3% | CR 4% |
|---|---|---|---|---|
| $0.40 | $26.67 | $20.00 | $13.33 | $10.00 |
| $0.60 | $40.00 | $30.00 | $20.00 | $15.00 |
| $0.80 | $53.33 | $40.00 | $26.67 | $20.00 |
| $1.00 | $66.67 | $50.00 | $33.33 | $25.00 |
Against an $18.14 break-even, only the upper-right corner makes money. A $14 CPA takes cheap clicks and a store converting at 3% or better. Most new stores convert closer to 1.5% to 2.5%. That’s the real reason beginners lose: two numbers have to land well at the same time, and neither one is fully in your control.
Two practical rules:
- Fix conversion rate before buying more traffic. Moving CR from 2% to 3% at a $0.60 CPC drops CPA from $30 to $20 without touching a single ad.
- Treat CTR as a creative problem and CR as an offer problem. Low CTR means your video or image isn’t stopping the scroll. Good CTR with low CR points at your page, price, shipping time, or reviews.
Raise AOV before chasing cheaper clicks
It costs about the same to acquire a customer who spends $40 as one who spends $64. So the cheapest margin gain in dropshipping is usually a bigger cart, not a cheaper ad.
Say you add a two-pack at $64 with a combined cost of $33 (shared supplier shipping helps).
| Single item | Two-pack | |
|---|---|---|
| Price (AOV) | $40.00 | $64.00 |
| Product + shipping | $18.00 | $33.00 |
| Payment fees | $1.46 | $2.16 |
| Refunds (6%) | $2.40 | $3.84 |
| Contribution profit | $18.14 | $25.00 |
| Profit after a $15 CPA | $3.14 | $10.00 |
Same ad cost, roughly triple the profit per order. Bundles, “buy 2, save 10%,” and a cheap add-on at checkout all work here. Aim for a 20% to 30% AOV lift and test it before you go haggling with suppliers.
Count repeat customers, but don’t lean on them
LTV (customer lifetime value) is what a customer is worth over time, not just on the first order. A simple store version:
Contribution LTV = contribution profit per order × orders per customer
If 20% of buyers order once more within a year, you average 1.2 orders per customer. That’s $18.14 × 1.2 = $21.77. Repeat orders mostly come through email or SMS and cost almost nothing to win, so you can afford a CPA up to about $21.77 and still break even over 12 months.
It’s important to be honest about when this works. Consumables, pet supplies, hobby gear, and anything with matching add-ons get reordered. A one-off novelty gadget doesn’t. It also won’t rescue a broken first order: if CPA is $35 against an $18 contribution, no repeat rate fixes that. This is a big part of why niche stores net more than general ones.
Test channels beyond Meta and TikTok
Meta and TikTok interrupt people. Nobody scrolling Instagram is shopping for your product, which is why that 3% conversion rate in the funnel table is so hard to hit. Google Shopping and Pinterest reach shoppers at a different moment, and each comes with its own catch.
Google Shopping. Your product shows up with a photo, price, and store name when someone searches for something like “insulated tumbler 40 oz.” These buyers already want to buy, so conversion rate is often higher. The catch is that your price sits right next to every other seller’s price. If your $40 item is $29 on Amazon, you lose the click. That’s the situation most AliExpress-style products are in. You’ll also need a Google Merchant Center account and a product feed, and many products need GTIN barcodes, which sourced items often don’t have. Shipping times and return policy have to match reality. Promising three-day delivery on a three-week shipment is a fast way to get suspended.
Pinterest. People use it to plan: home decor, gifts, weddings, crafts, fashion. Clicks are often cheaper, but buyers take longer to decide, so sales can land days or weeks after the click. A seven-day report makes Pinterest look worse than it is. It suits evergreen, visual products. It doesn’t suit impulse gadgets or anything that depends on urgency.
It’s tempting to assume higher intent means lower CPA. Not automatically. Intent lifts conversion rate, but competition lifts CPC, and CPA depends on the ratio of the two. Here’s how that plays out on our $40 product (break-even CPA is $18.14). These are illustrative scenarios, not benchmarks.
| Channel and scenario | CPC | CR | CPA | vs. $18.14 break-even |
|---|---|---|---|---|
| Meta or TikTok, decent cold setup | $0.50 | 3.0% | $16.67 | Under |
| Meta or TikTok, typical new store | $0.60 | 2.0% | $30.00 | Over |
| Google Shopping, commodity item, many sellers | $0.80 | 4.0% | $20.00 | Over |
| Google Shopping, niche item, few sellers | $0.45 | 4.0% | $11.25 | Under |
| Pinterest, strong visual fit | $0.30 | 2.0% | $15.00 | Under |
| Pinterest, weak fit | $0.30 | 1.2% | $25.00 | Over |
The pattern is clear enough. Google Shopping pays off on products you can differentiate: a bundle, a unique design, a niche nobody else lists. It struggles on commodity goods. Pinterest pays off when the product looks good in a photo and people save it for later.
A workable order of operations: find winning creative on Meta or TikTok, where learning is cheap and fast. Once a product has proven margin, add Google Shopping to catch people already searching for it, and Pinterest if the product is visual. Don’t split a small budget across four channels. Run one until it clearly works or clearly doesn’t.
One more catch. Every platform takes credit for the same sale, so Meta says it drove the order and Google says the same thing. Judge the mix by MER, your total revenue divided by total ad spend, not by each dashboard.
Use break-even CPA and ROAS as your gatekeepers
Forget the “max CPA = price × margin ÷ 2” shortcuts floating around. They don’t hold up. Use this instead:
Break-even CPA = price − product cost − shipping − payment fees − expected refunds
For our product: $40 − $18 − $1.46 − $2.40 = $18.14. Pay more than that for a customer and you lose money on the first order.
To translate it into something your dashboard shows, use ROAS (revenue ÷ ad spend):
Required ROAS = 1 ÷ (contribution margin − target net margin)
Our contribution margin is $18.14 ÷ $40 = 45.4%. Here’s how the target changes with margin:
| Contribution margin | Break-even ROAS | ROAS for 10% net | ROAS for 20% net |
|---|---|---|---|
| 30% | 3.33 | 5.00 | 10.00 |
| 40% | 2.50 | 3.33 | 5.00 |
| 45% | 2.22 | 2.86 | 4.00 |
| 50% | 2.00 | 2.50 | 3.33 |
| 60% | 1.67 | 2.00 | 2.50 |
In the 30% row, you need a 5.0 ROAS just to net 10%, and cold traffic rarely delivers that. It’s why $15 gadgets die in testing while a $60 product with a 60% contribution margin survives on average ads. The table ignores fixed costs like software and your time, so treat it as a floor.
Before you test any product, calculate its contribution margin. Under 40%, it needs to be exceptional. Otherwise, move on.
Pick a platform that fits your margin
Where you sell sets your fees, your rules, and how much traffic you have to buy. Besides Shopify, you can run a store on WooCommerce, list on marketplaces like Amazon and eBay, or sell through TikTok Shop. Each trades control for convenience in a different way. Rough picture below, but verify current rates before relying on them.
| Platform | Upfront cost | Selling fees | Dropshipping rules | Best for |
|---|---|---|---|---|
| Shopify | Roughly $29 to $39/month | 2.9% + $0.30 with Shopify Payments (basic plan, U.S.) | Allowed | Paid-ads stores, branding, email |
| WooCommerce | Free plugin, plus hosting and a domain (roughly $15 to $50/month) | Payment processor only (Stripe or PayPal, about 2.9% + $0.30) | Allowed | Owners who want control and don’t mind maintenance |
| Amazon | Professional plan around $39.99/month | Referral fee by category, commonly 8% to 15% | Strict. You must be the seller of record, and buying from another retailer to ship straight to the customer is not allowed | Private-label and established brands, not AliExpress-style dropshipping |
| eBay | Optional store plan | Final value fee often around 13% on most categories, plus a per-order fee | Allowed with conditions. Sourcing from other retailers and shipping direct is restricted | Used and niche goods, sellers with reliable suppliers |
| TikTok Shop | No monthly fee | Referral and per-order fees. Check Seller Center | Strict shipping-time and platform rules | Short-video products with strong creative |
The tradeoff, simply put: marketplaces bring you buyers, which can cut your ad spend, but they take a bigger slice of every sale and block the classic “list it, then order from AliExpress” model. Shopify and WooCommerce give you control and better margins per order. However, you pay for every visitor.
Choose suppliers with shipping time in mind
| Supplier type | Examples | Typical shipping | Tradeoff |
|---|---|---|---|
| Marketplace sourcing | AliExpress | 10 to 25 days | Lowest cost, slowest delivery, more refunds and chargebacks |
| Agents with warehouses | CJ Dropshipping | Faster from U.S. or EU warehouses, slower from China | Custom packaging and sourcing help, quality varies by product |
| Curated U.S./EU suppliers | Spocket and similar | Often 3 to 7 days | Higher product cost, better customer experience |
| Print-on-demand | Printful, Printify | 3 to 8 days plus production | Low risk, but product cost eats margin |
Faster shipping isn’t automatically better. Say a U.S. warehouse adds $3 to your product cost and cuts refunds from 6% to 4%. The refund savings are only $0.80 an order, so you’re $2.20 worse off. It pays off only if conversion rate rises. At a $0.50 CPC, moving CR from 2.5% to 3.0% drops CPA from $20.00 to $16.67. That $3.33 saving beats the $2.20 cost. Test with a handful of orders before committing.
Budget for the search, not just the store
Nobody likes this part. My planning assumption (an estimate, not a measured stat) is that roughly 1 in 10 products you test will be worth scaling.
A fair test costs about $75 to $150 in ads per product. That’s enough to run a few creatives and see whether anyone buys. For a $40 product, a decent rule is to kill it after $60 to $80 with no purchase.
| Item | Realistic cost |
|---|---|
| 10 product tests | $750 to $1,500 |
| Store, theme, apps (first 3 months) | $200 to $500 |
| Sample orders for a quality check | $100 to $300 |
| Business formation, bookkeeping setup | $100 to $500 |
| Buffer for refunds and a bad week | $500 to $1,000 |
| Total | $1,650 to $3,800 |
You can start with less. Just know that if you run out of cash at product 6, you quit right before the odds catch up.
Expect a slow first year
This is my expectation for someone working part-time (about 20 to 25 hours a week) on a modest budget.
| Stage | What happens | Typical profit |
|---|---|---|
| Months 1 to 3 | Building, testing, mostly losing small | −$1,500 to −$3,000 total |
| Months 4 to 6 | One product starts working, ads still inconsistent | −$500 to +$800/month |
| Months 7 to 12 | Fixing returns, shipping times, and creatives | $500 to $3,000/month |
| Year 2 | Either a brand with repeat buyers or burnout | Wide range |
Plan around the odds
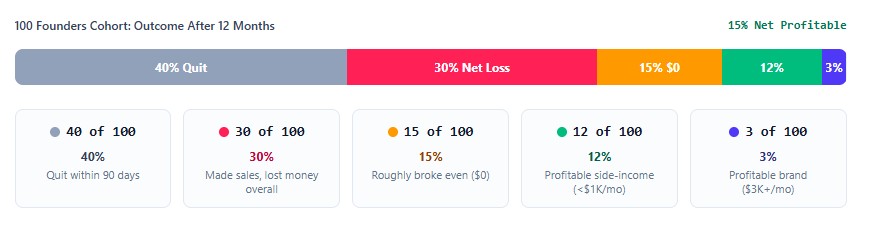
Nobody publishes clean data on how many dropshippers succeed, and the “90% fail” line you see everywhere has no solid source. So here’s my own estimate for 100 people who launch a store and work it seriously for 12 months.
| Outcome after 12 months | Out of 100 |
|---|---|
| Never made a sale, or quit within 90 days | ~40 |
| Made sales but lost money overall | ~30 |
| Roughly broke even | ~15 |
| Profitable, under $1,000/month | ~12 |
| Profitable, $3,000+/month | ~3 |
Treat it as a planning estimate. The shape is what matters: a small group wins, and the median result is a loss.
Compare margins by business model
These ranges are for stores that are actually run well, not hype numbers.
| Model | Typical net margin | Why |
|---|---|---|
| General store, cold ads, AliExpress or CJ suppliers | 5% to 12% | High CPA, slow shipping, more refunds |
| Niche store with a clear audience | 10% to 20% | Better CR, some repeat buyers |
| Print-on-demand | 8% to 18% | Low risk, but product cost eats margin |
| Branded store with repeat customers | 15% to 25% | Higher AOV and LTV, email cuts ad dependence |
The gap between the first and last row isn’t about picking better products. It’s AOV and repeat purchases. If 25% of buyers order again and bundles lift your cart size, your effective acquisition cost drops hard. In my experience, that’s the biggest margin lever there is.
Plan for frozen cash: reserves, payout holds, and chargebacks
Your P&L says you’re profitable. Your bank account says you’re broke. That gap sinks more growing stores than bad products do. Dropshipping makes it worse, because you pay the ad platform and the supplier now and get paid later.
How processor reserves work
Stripe, Shopify Payments, and PayPal take on risk the moment they pay you out. If they think refunds and disputes could outrun what your account covers, they can hold part of your payouts (a rolling reserve), slow your payouts down, or pause the account for review. Amounts, timing, and triggers are up to the processor. There’s no standard rate. I’m using 10% and 20% held for 90 days as planning scenarios, not as published numbers, so read your own account terms.
Things that tend to trigger a hold: a brand-new account, a fast jump past the volume you estimated at signup, a dispute rate approaching 1%, long delivery times, higher-risk categories, and lots of international orders. A store that scales quickly with slow shipping from overseas ticks most of those boxes.
Here’s what a rolling 90-day hold locks up at each stage of our P&L.
| Monthly revenue | Monthly net profit | Cash held at 10% | Months of profit locked | Cash held at 20% | Months of profit locked |
|---|---|---|---|---|---|
| $10K | $585 | $3,000 | 5.1 | $6,000 | 10.3 |
| $50K | $6,150 | $15,000 | 2.4 | $30,000 | 4.9 |
| $100K | $12,100 | $30,000 | 2.5 | $60,000 | 5.0 |
The shortcut: months of profit locked = 3 × reserve % ÷ net margin. The thinner your margin, the longer you wait to see your own money. At $10K, a 10% hold equals five months of profit. At that size a reserve isn’t a nuisance, it’s the whole business.
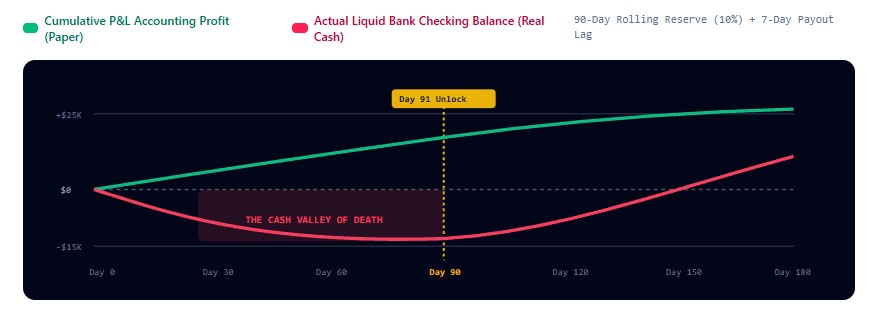
The table shows steady state. It builds as you scale. Go from $10K to $30K to $50K over three months and about $9,000 sits in reserve at the end of month three, before the first batch is released.
Payout timing adds to it. Standard payouts take a few business days, and new accounts can wait longer. Seven days of sales in transit at $50K a month is roughly $11,700. Meanwhile, ad platforms bill your card daily or at set thresholds, and suppliers want payment per order.
LTV doesn’t fix this, either. Repeat customers pay off over twelve months, but a reserve hits in the first ninety days. A high LTV lets you afford a higher CPA only if you have the cash to wait for the second orders.
Chargebacks versus refunds
A chargeback happens when the customer goes to their bank instead of to you. You pay a dispute fee (typically around $15 in the U.S., win or lose), you lose the order, and the dispute counts against your ratio. A refund you issue yourself carries no dispute fee and doesn’t count as a dispute. The processing fee is usually not returned on a refund either way, so check your processor’s terms.
In practice: when someone writes “where’s my order?” and the tracking has gone cold, refund them quickly. Waiting for them to call the bank costs more.
Most sellers treat a dispute rate around 1% as the danger zone. Card network programs and thresholds differ and change, so check your processor’s current rules. At 1,250 orders a month, 1% is about 12 or 13 disputes: roughly $190 in fees and $500 in lost orders. The cash is the smaller problem. The bigger one is what that ratio does to your reserve.
How to keep the hold small
- Ship with tracking and show honest delivery times. Most dropshipping disputes are “item not received.” A clear estimate on the product page prevents many of them.
- Use a billing descriptor customers recognize. People dispute charges they don’t remember making.
- Turn on dispute alerts if your processor offers them. They let you refund before a chargeback is filed.
- Answer every dispute on time with tracking, the order confirmation, and your policies.
- Raise ad budgets in steps. Many sellers use 20% to 30% at a time. Doubling volume overnight is a classic way to trip a review.
- Hold cash for the scale you’re aiming for. If you’re heading to $30K a month, set aside what a 10% hold at that level would lock up. That’s about $9,000.
- Don’t open extra processor accounts to dodge a hold. It breaks most terms of service and gets accounts closed. Offering a second legitimate payment method, such as PayPal next to cards, is fine.
Watch the costs nobody puts in the pitch
- Slow shipping creates refunds. A 15 to 25 day delivery window brings “where’s my order?” emails, chargebacks, and angry reviews. Card processors typically charge around $15 per dispute, win or lose.
- Refunds without returns. Shipping a $10 item back overseas costs more than the item, so most dropshippers refund and let the customer keep it. You lose the revenue and the product cost.
- Payout reserves and holds. Covered in the cash section above. Budget for them like any other cost.
- Ad account bans. If your only traffic source vanishes for a week, so does your month. Keep a backup account and a second channel.
- Import costs. The U.S. ended duty-free treatment for low-value imports in 2025, and tariff rules have kept shifting. If your supplier ships from overseas, check current duty and fee rules for your category. They can change your cost per order overnight.
- Software creep. Reviews app, email tool, upsell app, support desk. $150 a month is easy to hit, and that’s 15% of profit at the $10K stage.
Avoid the mistakes that wreck the math
- Counting sales tax as revenue or as an expense. It’s collected from the customer. Track it separately.
- Judging profit from the ad dashboard. Meta’s ROAS ignores refunds, product cost, and fees. Use your store’s real net profit.
- Scaling on three days of data. Early winners often fade. Wait for a week or more of stable CPA before raising budgets.
- Ignoring blended numbers. Track MER across all channels, not only per-platform reports.
- Pricing by gut. A $40 price that “feels right” can still lose money. Run contribution margin first.
- Buying traffic for a weak page. If CTR is fine and CR sits under 1.5%, more ad spend just burns cash faster.
- Scaling faster than your cash can follow. Reserves and payout delays can lock up months of profit. Profitable on paper and unable to pay the ad bill is a real place to end up.
Run this checklist before testing a product
Go in order. Stop at the first “no.”
- Is contribution margin at least 40% after supplier shipping, fees, and a 6% refund allowance?
- Is break-even CPA at least $15?
- Can you realistically hit a CPC near $0.60 or lower with a CR near 2.5% or better? (Check the funnel table.)
- Can you bundle it or add an upsell to lift AOV?
- Can you get a sample in under two weeks and check the quality yourself?
- Is there a reason for customers to buy again, or buy a related item?
- Can you afford a $75 to $150 test without it hurting?
- If it works, can you fund the scale-up, including a 10% reserve for 90 days and payouts that land a week late?