The average gift shop net profit margin ranges from 8% to 12% in 2026, with gross margins typically between 50% and 60%. Top-performing hybrid models (online + retail) achieve 14-20% net margin, while tourist-dependent shops in high-rent corridors often compress to 6-10%. State tax structure, rent as a percentage of revenue, and sourcing strategy are the three largest determinants of profitability.
Critical Retail KPIs: Beyond Profit Margin
Profit margin tells you if the business is viable. These four operational KPIs tell you if it’s healthy.
| KPI | Formula | Target Benchmark | What It Measures |
|---|---|---|---|
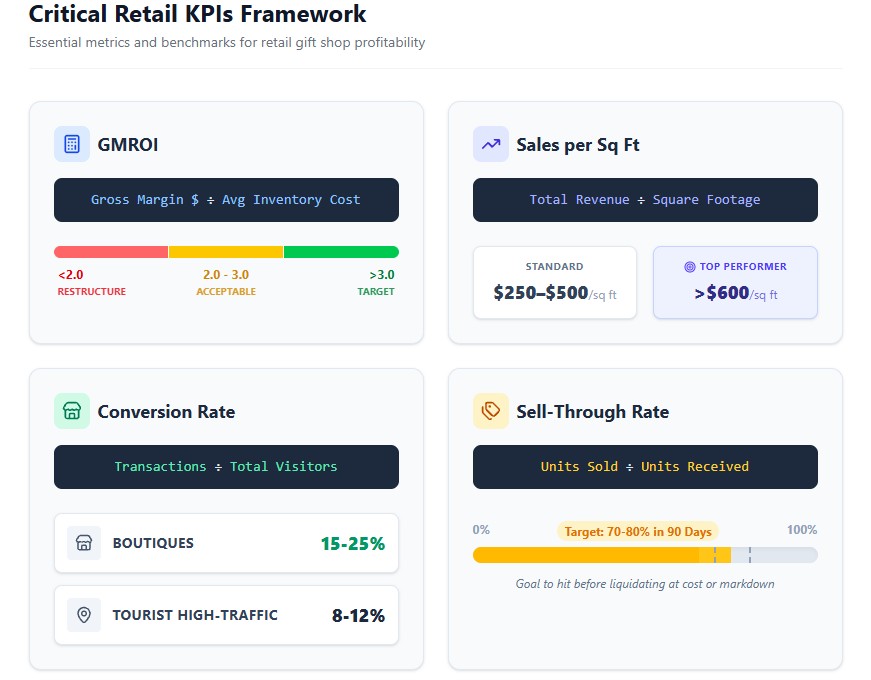
| GMROI (Gross Margin Return on Investment) | Gross Margin $ ÷ Average Inventory Cost | >3.0 (excellent), 2.0-3.0 (acceptable), <2.0 (restructure) | How many dollars you earn back for every $1 invested in inventory |
| Sales per Square Foot | Annual Revenue ÷ Store Sq Ft | $250-$500/sq ft (gift shops), >$600 (high-performing) | Space productivity and rent efficiency |
| Conversion Rate | Transactions ÷ Store Visitors | 15-25% (boutiques), 8-12% (tourist high-traffic) | Effectiveness of merchandising and staff engagement |
| Sell-Through Rate | Units Sold ÷ Units Received (before markdown) | 70-80% (before 90-day mark) | Inventory velocity and buying accuracy |
GMROI Example: A shop with $275K gross profit and $100K average inventory = GMROI of 2.75. This means every $1 invested in inventory returns $2.75. Target is 3.0+ ($300K gross profit on $100K inventory).
Sales per Square Foot Context: A 1,200 sq ft shop doing $500K annual revenue = $417/sq ft. This is healthy for gift retail. If the same shop does $300K = $250/sq ft, rent is likely too high for the revenue generated.
Conversion Rate Reality: Tourist shops see 100+ visitors/hour but convert only 8-12% (browsers, window-shoppers). Local boutiques see 10-20 visitors/hour but convert 20-25% (intentional buyers). Optimize for conversion rate, not foot traffic.
Sell-Through Rate Rule: If less than 70% of a product line sells through at full price within 90 days, the remaining 30% will likely be liquidated at cost or below. This is why buying discipline matters more than markup.
Margin by Business Model
Not all gift shops operate the same way. Profitability varies dramatically based on customer base, product mix, and distribution channel.
| Business Model | Gross Margin | Net Margin | Annual Revenue Range | Characteristics |
|---|---|---|---|---|
| Tourist Souvenir (FL, TX, NV) | 45-55% | 10-15% | $300K-$800K | Q4 = 50-55% of annual, high import mix, foot-traffic dependent |
| Local Community (Suburban) | 50-60% | 8-12% | $200K-$500K | Stable year-round, domestic wholesale focus, repeat customers |
| Museum/Cultural Institution | 55-65% | 12-18% | $150K-$600K | Exclusive products, captive audience, visitor-volume dependent |
| Hybrid Online + Retail | 60-70% | 14-20% | $400K-$1M+ | 30-40% online revenue, private label emphasis, higher ATV |
| Consignment-Heavy | 40-50% | 6-10% | $150K-$400K | Low capital risk, vendor-dependent, unique/local product focus |
| Import-Direct (Alibaba) | 65-75% | 8-14% | $500K-$2M+ | High MOQ, tariff exposure, 60-90 day lead time, commodity focus |
Tourist shops in Florida, Texas, and Nevada benefit from no state income tax and year-round visitor traffic, but face extreme seasonality (Q1-Q2 revenue = 35-40% of Q4). Museum stores achieve the highest margins (12-18% net) due to exclusive products and captive audiences, but are vulnerable to visitor volume fluctuations. Hybrid models (online + retail) are the top performers (14-20% net) because they smooth seasonality and achieve higher average transaction values online ($65+ vs $42 in-store).
Where the Money Goes: Standard P&L Structure
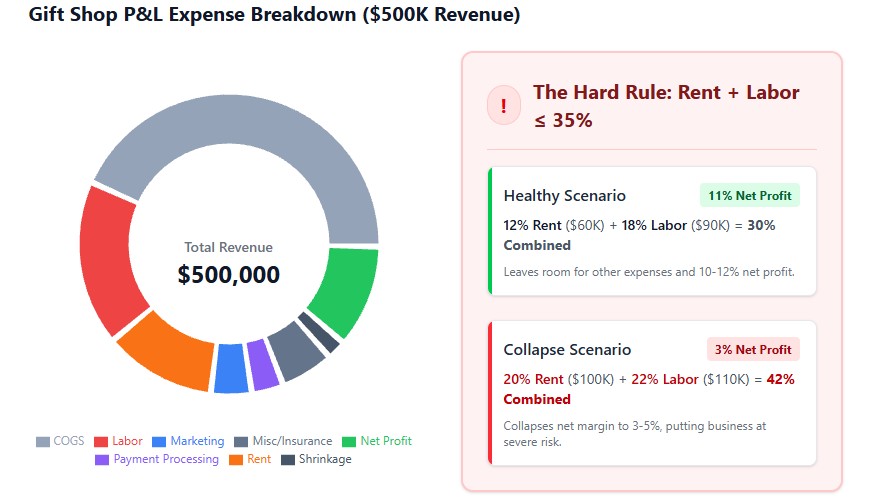
For a typical $500,000 annual revenue gift shop, expenses break down as follows:
| Category | % of Revenue | Dollar Amount | Industry Benchmark | Action Threshold |
|---|---|---|---|---|
| COGS | 40-50% | $200K-$250K | 45% typical | >50% = audit vendor mix |
| Labor | 15-25% | $75K-$125K | 18% typical | >25% = restructure staffing |
| Rent + Utilities | 10-18% | $50K-$90K | 12-14% typical | >18% = renegotiate or relocate |
| Payment Processing | 2.5-3.5% | $12.5K-$17.5K | 2.9% typical | >3.2% = switch to interchange-plus |
| Shrinkage | 1.4-2.0% | $7K-$10K | 1.6% (NRF) | >2% = implement controls |
| Marketing | 3-5% | $15K-$25K | 4% typical | >6% = optimize channels |
| Insurance, Licenses, Misc | 2-3% | $10K-$15K | 2.5% typical | — |
| Total Operating Expenses | 73-88% | $365K-$440K | 80-82% typical | — |
| Net Profit (Pre-Tax) | 12-27% | $60K-$135K | 10-15% typical | <8% = restructuring needed |
The 35% Rule: Rent + Labor should never exceed 35% of gross revenue. If rent is 20% (prime tourist location), labor must be ≤15% (lean staffing, owner-operated).
Example: A shop doing $500K with 12% rent ($60K) and 18% labor ($90K) = 30% combined, leaving room for other expenses and 10-12% net profit. The same shop with 20% rent ($100K) and 22% labor ($110K) = 42% combined, collapsing net margin to 3-5%.
State-by-State Profitability
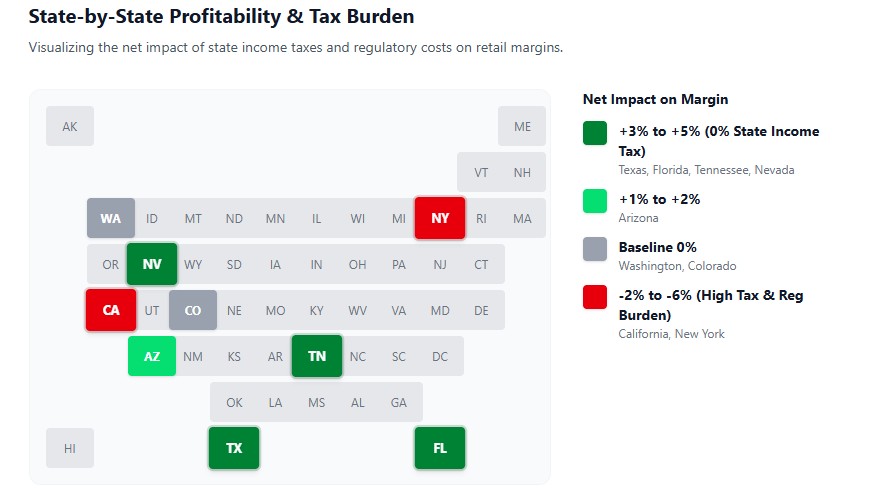
Geography is the single largest determinant of net margin. State tax structure, minimum wage, and commercial rent create 5-8% margin differences between high-cost and low-cost states.
Tax and Regulatory Environment
| State | Sales Tax (Max) | State Income Tax | Min. Wage | Regulatory Burden | Net Margin Impact |
|---|---|---|---|---|---|
| Texas | 8.25% | 0% | $7.25 (federal) | Low | +3-5% vs national avg |
| Florida | 8.5% | 0% | $12.00 | Low | +2-4% vs national avg |
| Tennessee | 9.75% | 0% | $7.25 (federal) | Low | +3-5% vs national avg |
| Nevada | 8.38% | 0% | $12.00 | Low | +2-4% vs national avg |
| Washington | 10.5% | 0% | $16.28 | Medium (EPR laws) | 0% vs national avg |
| Arizona | 11.2% | 2.5-4.5% (flat) | $15.00 | Low | +1-2% vs national avg |
| Colorado | 11.2% | 4.4% (flat) | $15.00 | Medium | 0% vs national avg |
| New York | 8.875% | 4-10.9% | $15.00 (NYC) | Medium | -2-3% vs national avg |
| California | 10.75% | 1-13.3% (progressive) | $16.50 | High (Prop 65, bag ban, packaging EPR) | -4-6% vs national avg |
Source: Tax Foundation State Tax Competitiveness Index
Example: A gift shop generating $80,000 in owner profit keeps:
- $80,000 in Texas (0% state income tax)
- $58,000 in California (13.3% top bracket + regulatory costs)
That’s a $22,000 difference on identical operations.
Rent Benchmarks by Market
| Market Type | Rent (per sq ft annually) | 1,200 sq ft Monthly | Target % of Revenue |
|---|---|---|---|
| Suburban strip mall (TX, FL, TN) | $18-$28 | $1,800-$2,800 | 10-14% |
| Suburban strip mall (CA, WA, NY) | $36-$60 | $3,600-$6,000 | 12-18% |
| Tourist corridor (secondary) | $30-$48 | $3,000-$4,800 | 15-20% |
| Tourist corridor (prime: Vegas Strip, Orlando I-Drive) | $60-$120 | $6,000-$12,000 | 18-22% (max) |
| Downtown boutique (major city) | $48-$96 | $4,800-$9,600 | 15-20% |
| Mall kiosk (regional) | $72-$144 | $6,000-$12,000 | 20-25% (high risk) |
Profit Margin Trends: 2021-2027
Net profit margins for U.S. gift shops have compressed over the past five years due to rising rent, labor costs, and tariff exposure. The average independent shop went from 12-16% net margin in 2021 to 8-12% currently, with significant variation by business model and location.
| Year | Average Net Margin | Key Drivers |
|---|---|---|
| 2021 | 12-16% | Post-pandemic recovery, low interest rates, stable rent |
| 2022 | 11-14% | Inflation spike, supply chain disruptions, freight costs up 40-60% |
| 2023 | 10-13% | Minimum wage increases (CA, WA, NY), tariff reinstatement on Chinese goods |
| 2024 | 9-12% | Commercial rent resets after 3-year leases, payment processing rate hikes |
| 2025 | 8-12% | Consumer gift spending down 11%, regulatory costs (packaging EPR laws) |
| Current | 8-12% | Stabilization, but margin pressure from labor and tariffs persists |
| 2027 (projected) | 7-11% | Potential tariff increases to 35%+, continued rent growth in tourist markets |
Sources: IBISWorld Gift Shops & Card Stores, NRF Retail Benchmarks, Bureau of Labor Statistics
Key inflection points:
- 2022: Freight costs from China increased 40-60% due to container shortages, compressing import margins by 5-8%
- 2023: Section 301 tariffs (25% on Chinese ceramics, textiles, plastics) fully reinstated after pandemic suspension
- 2024-2025: Commercial rent resets at 15-25% higher rates in tourist corridors (Orlando, Las Vegas, Miami)
- 2025: California, Washington packaging EPR laws added 3-5% to operational costs for retailers
Sourcing Strategy: Landed Cost vs. Wholesale Price
The difference between 55% gross margin and 70% gross margin often comes down to sourcing strategy. But “cheap” imports aren’t cheap once you calculate landed cost.
Sourcing Model Comparison
| Model | Typical Gross Margin | Capital Required | Lead Time | Risk Level | Best Use Case |
|---|---|---|---|---|---|
| Domestic Wholesale (USA) | 45-55% | $5K-$20K | 5-7 days | Low | Staples, premium positioning, fast-turn items |
| Import Direct (China/India) | 65-75% | $10K-$50K+ | 60-90 days | High | Commodity items (mugs, magnets, keychains), high volume |
| Consignment (Local Artisans) | 40-50% (retailer keeps 40-60% of sale) | $0 | 1-3 days | Low | Testing new categories, unique/local products, high-ticket items |
| Faire/Handmade Platforms | 50-60% | $2K-$10K | 7-14 days | Low-Medium | Curated boutiques, hybrid models |
| Liquidation/Overstock | 60-80% | $1K-$5K | 3-7 days | Medium | Impulse items, seasonal promotions, clearance |
Landed Cost Calculation: Import vs. Domestic
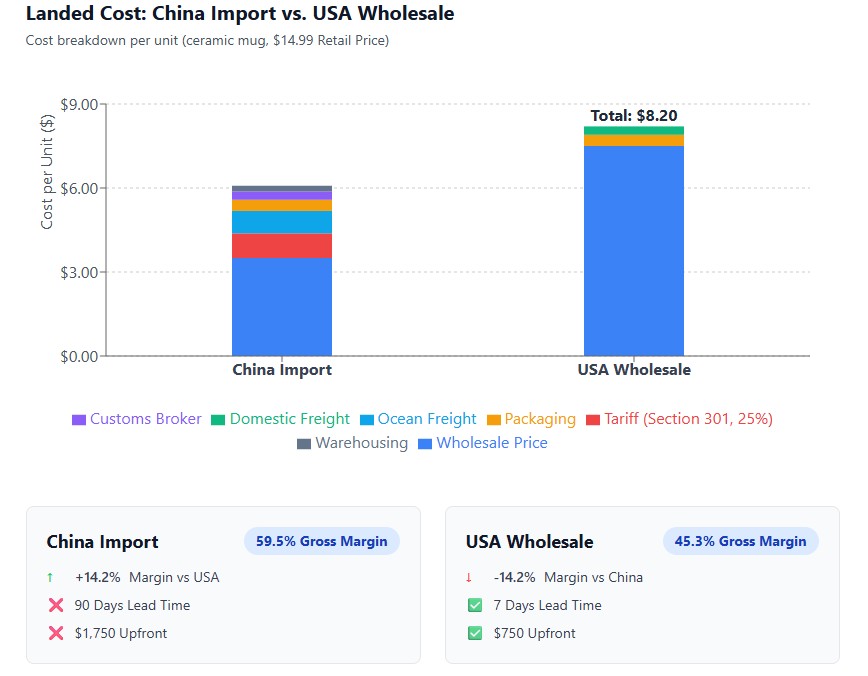
Example: Ceramic Mug, 500-unit order
| Cost Component | China Import | USA Wholesale |
|---|---|---|
| Wholesale Price | $3.50/unit | $7.50/unit |
| MOQ | 500 units ($1,750) | 100 units ($750) |
| Ocean Freight | $0.80/unit | — |
| Domestic Freight | — | $0.30/unit |
| Tariff (Section 301) | 25% = $0.875/unit | $0 |
| Customs Broker | $0.30/unit | $0 |
| Warehousing (60 days) | $0.20/unit | — |
| Retail Packaging | $0.40/unit | $0.40/unit |
| Total Landed Cost | $6.075/unit | $8.20/unit |
| Retail Price | $14.99 | $14.99 |
| Gross Margin | 59.5% | 45.3% |
Margin Advantage: Import = +14.2% gross margin
Trade-offs:
- 5x more upfront capital ($1,750 vs $750)
- 60-90 day lead time vs 5-7 days
- Quality risk (no pre-shipment inspection)
- Tariff risk (current 25%, potential increase to 35%+)
Recommendation: Use imports for high-turn commodity items (inventory turnover >8x/year). Use domestic/consignment for unique, premium, or experimental products.
Seasonality and Cash Flow
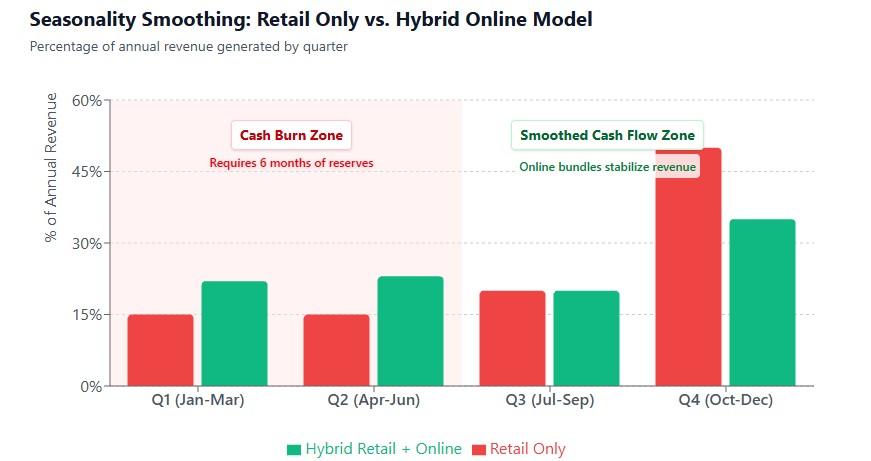
Tourist-dependent shops face extreme revenue concentration in Q4. Without proper cash reserves or diversified revenue streams, Q1-Q2 can burn through profits earned during the holidays.
Quarterly Revenue Distribution
| Quarter | Tourist Shops | Local/Suburban Shops | Museum Stores |
|---|---|---|---|
| Q4 (Oct-Dec) | 50-55% | 40-45% | 50-60% |
| Q3 (Jul-Sep) | 20-25% | 25-30% | 20-25% |
| Q2 (Apr-Jun) | 15-20% | 25-30% | 15-20% |
| Q1 (Jan-Mar) | 15-20% | 25-30% | 14-18% |
Source: LendingTree Post-Holiday Retail Study, Museum Store Association
Cash Flow Requirement: Tourist shops need 6 months of operating expenses in cash reserves. For a $500K annual shop with $10K/month burn rate in Q1-Q2, that’s $60K in reserves.
Hybrid Model Advantage
Shops with 30-40% online revenue see less extreme seasonality:
| Metric | Retail Only | Hybrid (Retail + Online) |
|---|---|---|
| Q4 % of Annual | 50-55% | 40-45% |
| Q1-Q2 % of Annual | 30-35% | 45-50% |
| Average Transaction Value | $42 | $42 (retail) vs $65+ (online) |
| Net Margin | 8-12% | 14-20% |
Online gift bundles and subscription boxes smooth cash flow by generating revenue during traditionally slow months.
Operational Benchmarks
Inventory Turnover by Category
| Product Category | Target Turnover (x/year) | Days of Inventory | Margin Impact if Slower |
|---|---|---|---|
| Imported Novelties (mugs, magnets, keychains) | 8-10x | 36-45 days | Dead stock after 120 days |
| Domestic Wholesale (candles, home decor) | 6-8x | 45-60 days | Markdown after 90 days |
| Consignment (local art, jewelry) | 4-6x | 60-90 days | Return to vendor after 90 days |
| Private Label / Bundles | 6-8x | 45-60 days | Core profit driver, maintain stock |
| Seasonal/Holiday | 12x+ | 30 days | Liquidate at cost after season |
Industry Average: 6-8x annual turnover for gift shops
Formula: If annual COGS = $250K, target average inventory = $250K ÷ 7 = $35K-$40K
Shrinkage: The 1.6% Profit Leak
NRF Average: 1.6% of revenue = $8,000/year on $500K shop
| Loss Type | % of Total Shrinkage | Prevention Strategy |
|---|---|---|
| Shoplifting | 40% | Move $30+ items within 3 feet of register, eliminate blind spots |
| Employee Theft | 30% | Manager codes for voids/returns, weekly inventory audits on top 20 SKUs |
| Admin Errors | 20% | Vendor check-in process (count before signing), POS training |
| Vendor Fraud | 10% | Delivery verification, invoice reconciliation |
ROI Example: $2,000 cameras + $500 training = $4,000-$6,000/year saved.
Payment Processing Optimization
| Monthly Card Volume | Flat-Rate (2.6% + $0.10) | Interchange-Plus (2.1% + $0.08) | Monthly Savings |
|---|---|---|---|
| $20,000 | $530 | $500 | $30 |
| $30,000 | $790 | $710 | $80 |
| $40,000 | $1,050 | $920 | $130 |
| $50,000 | $1,310 | $1,130 | $180 |
Threshold: Switch to interchange-plus at $25K+/month in card volume. Annual savings: $2,000-$4,000.
Business Model Breakdown
Tourist Souvenir Shop (Orlando, Las Vegas, Miami Beach)
Revenue: $400K-$800K annual | Q4: 50-55% | ATV: $22-$35
Optimal Product Mix:
- 60% imported novelties → 65-70% GM
- 25% local/artisan goods → 50-55% GM
- 15% consignment (art, jewelry) → 40% GM, zero risk
Critical Success Factor: Inventory turnover >8x/year (45-day cycle). Liquidate at cost if item doesn’t sell in 60 days.
Local Community Gift Shop (Suburban, Small Town)
Revenue: $200K-$500K annual | Q4: 40-45% | ATV: $35-$55
Optimal Product Mix:
- 40% domestic wholesale (home decor, candles, stationery) → 50-55% GM
- 35% consignment (local art, jewelry, food) → 40-50% GM
- 25% private label (custom packaging, house brand) → 65-70% GM
Critical Success Factor: Customer retention >35% (repeat locals, gift registries). Win on curation + service, not price.
Museum/Cultural Institution Store
Revenue: $150K-$600K annual | Q4: 50-60% | ATV: $28-$45
Optimal Product Mix:
- 50% exhibition-related (books, replicas, themed items) → 55-60% GM
- 30% local/regional artisan goods → 50-55% GM
- 20% general gift (cards, jewelry, home) → 45-50% GM
Critical Success Factor: Exclusive products (can’t buy elsewhere). Generic merchandise = race to the bottom on price.
Hybrid Online + Retail
Revenue: $400K-$1M+ annual | Online: 30-40% | ATV: $42 (retail) vs $65+ (online)
Optimal Product Mix:
- 40% private label (exclusive to you) → 65-70% GM
- 30% domestic wholesale → 50-55% GM
- 20% consignment → 40-50% GM
- 10% imported → 65-70% GM
Critical Success Factor: Online customer acquisition cost < $18. Don’t underprice to “compete” with Amazon.
Market Dynamics and Forecast
Tariff and Trade Policy
- Section 301 tariffs on China: 25% on most consumer goods (ceramics, textiles, plastics)
- De minimis threshold: $800 (shipments under this value = no duty), but scrutiny increasing
- 2027 Outlook: Potential tariff increases to 35%+ depending on trade policy
Strategy: Diversify sourcing across Vietnam, India, Mexico, and USA to reduce tariff exposure.
Consumer Behavior Shifts
- Gift spending down 11% in 2025 (first decline since 2020)
- Experiential gifts up 18% (subscriptions, classes, local experiences)
- Sustainability premium: 23% of consumers pay 10-15% more for eco-friendly packaging
Technology and Automation
- AI inventory forecasting: Tools like InventoryLab, TradeGecko predict demand with 85-90% accuracy
- Dynamic pricing: Automated repricing based on seasonality, competitor prices
- Omnichannel POS: Square, Shopify, Lightspeed unify online + offline inventory ($100-$300/month)
Financial Model: $500K Annual Revenue Shop
Baseline P&L (Healthy Operation)
| Category | % | $ Amount | Notes |
|---|---|---|---|
| Revenue | 100% | $500,000 | $41,667/month average |
| COGS | 45% | $225,000 | Mix: 40% wholesale, 35% consignment, 25% private label |
| Gross Profit | 55% | $275,000 | — |
| Labor | 18% | $90,000 | Includes owner’s draw |
| Rent | 12% | $60,000 | $5,000/month (suburban) |
| Utilities | 2.4% | $12,000 | $1,000/month |
| Payment Processing | 3% | $15,000 | Interchange-plus pricing |
| Shrinkage | 1.6% | $8,000 | NRF average |
| Marketing | 4% | $20,000 | Local SEO, Google Ads, social |
| Insurance, Licenses, Misc | 3% | $15,000 | — |
| Total Operating Expenses | 44% | $220,000 | — |
| Net Profit (Pre-Tax) | 11% | $55,000 | $4,583/month owner draw |
Stress Test: Margin Compression
| Scenario | COGS | Rent | Net Margin | Verdict |
|---|---|---|---|---|
| Baseline (above) | 45% | 12% | 11% | ✅ Healthy |
| COGS creep to 50% | 50% | 12% | 6% | ⚠️ Restructure sourcing |
| Rent increase to 18% | 45% | 18% | 5% | ⚠️ Renegotiate or relocate |
| Both (50% COGS + 18% rent) | 50% | 18% | 1% | ❌ Unsustainable |
90-Day Margin Improvement Plan
Weeks 1-2: Audit
- ☐ Run POS report: Identify bottom 20% of SKUs by margin + turnover
- ☐ Calculate landed cost on top 10 imported items (include tariffs, freight)
- ☐ Benchmark rent + labor: If >35%, model scenarios
- ☐ Calculate GMROI: If <2.5, reduce slow-turn inventory by 30%
Weeks 3-6: Optimize
- ☐ Liquidate dead inventory: 50% off on items >120 days old
- ☐ Switch payment processor: Get interchange-plus quote if >$25K/month volume
- ☐ Negotiate with 3 vendors: Ask for 5-10% discount on next order
- ☐ Track conversion rate: If <15%, retrain staff on engagement scripts
Weeks 7-12: Restructure
- ☐ Add 2-3 consignment vendors: Test local artisans (zero risk)
- ☐ Launch 1 private label bundle: Custom packaging on existing wholesale item
- ☐ Implement shrinkage controls: Move $30+ items near register, manager codes for voids
- ☐ Measure sell-through rate: If <70% at 90 days, adjust buying strategy
Expected Impact: +3-5% net margin within 90 days ($15K-$25K on $500K revenue)
Key Takeaways
- Location determines 3-6% of net margin before you open (state taxes, rent, minimum wage)
- Landed cost > wholesale price for import decisions (include tariffs, freight, warehousing)
- Rent + Labor ≤ 35% of revenue is a hard constraint
- Inventory turnover 6-8x/year minimum (45-60 day cycle)
- GMROI >3.0 = healthy buying, <2.0 = restructure vendor mix
- 6 months cash reserves required for tourist-dependent shops
- Hybrid online/retail adds 4-8% to net margin through higher ATV and lower rent per revenue dollar
- Shrinkage at 1.6% = pure profit leak (ROI on controls: 200-300%)
- Payment processing switch at $25K+/month = $2K-$4K/year savings
- Conversion rate 15-25% = effective merchandising, <12% = staff training needed