A Financial Goals (Monthly)
B Taxes & Time
If you are searching for a service business break-even calculator, you need more than a generic spreadsheet. You need a framework that accounts for the hidden reality of service work: the utilization rate, the self-employment tax multiplier, and the difference between gross revenue and actual project margin.
Let’s build your real break-even number, step by step.
The 3 Numbers That Actually Matter
Forget complex accounting jargon. To find your break-even point, you only need to accurately define three numbers.
1. Your “Keep the Lights On” Fixed Costs (Including Your Salary)
This is the money that leaves your business account every month, regardless of whether you land a single client. Crucially, your target market-rate salary belongs in this column. If you wouldn’t hire a stranger to do your job for less than $80,000 a year, you cannot calculate your break-even using a $40,000 owner draw.
Includes: Software (CRM, Adobe, QuickBooks), insurance, professional memberships, home office deduction portion, and your target salary.
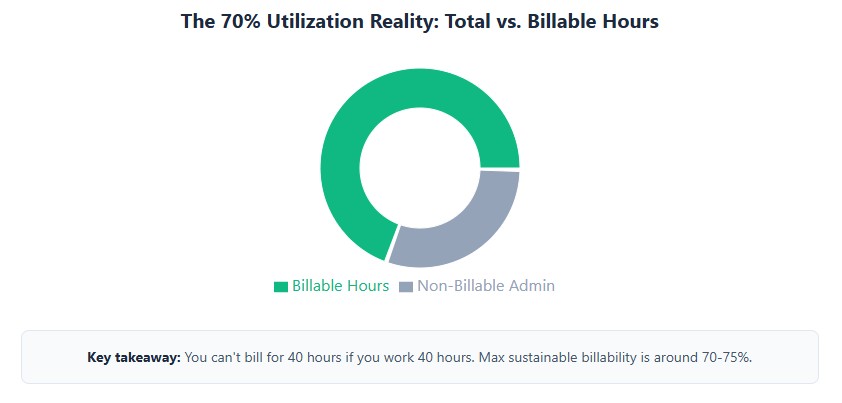
2. The Reality Check: Your Utilization Rate
A common fatal error is dividing annual costs by 2,080 hours (40 hours × 52 weeks). You are a business owner, not a factory robot. You have to sell, market, do admin, take sick days, and manage client relationships.
Industry data consistently shows that the maximum sustainable utilization rate (actual billable hours) for a solo service provider is 70% to 75%. If you work 40 hours a week, you can only realistically bill 28 to 30 of those hours. The rest is running the business.
3. The Silent Killer: The Tax Multiplier
If you are a Sole Proprietor or a single-member LLC, every dollar of net profit is subject to the 15.3% Self-Employment (SE) tax, on top of your regular income tax.
To break even after taxes, you cannot just add 25% to your costs. You need to gross up your target. A safe, conservative buffer for federal and state taxes for a profitable service business in 2026 is 25% to 30% of your total gross revenue.
The Ultimate Break-Even Formula
Now, let’s plug these numbers into the only formula you need to find your minimum viable hourly rate.
(Total Annual Fixed Costs + Target Salary + Tax Buffer) ÷ (Total Available Hours × Utilization Rate) = True Break-Even Hourly Rate
Real-World Example: The Freelance UX Designer
Let’s look at Sarah, a freelance UX designer in Austin, Texas. She wants to know her true break-even rate for 2026.
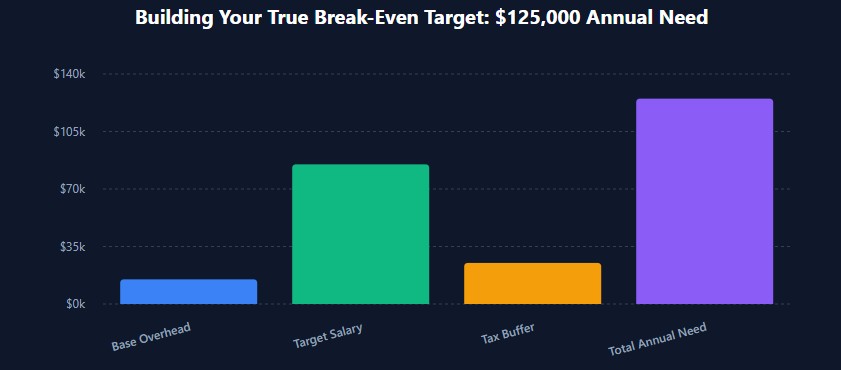
- Target Salary: $85,000
- Annual Fixed Overhead: $15,000 (Software, insurance, LLC fees, home office)
- Tax Buffer (25% of gross target): $25,000
- Total Annual Financial Need: $125,000
- Total Available Hours: 2,080 (40 hrs/week × 52 weeks)
- Utilization Rate: 70% (1,456 realistic billable hours)
The Math: $125,000 ÷ 1,456 hours = $85.85 per hour.
The Insight: If Sarah charges $60/hour because “that’s what the market bears,” she is actively losing money. She might have cash in the bank at the end of the month, but she is subsidizing her clients with her own unpaid labor and deferred taxes. Her absolute floor is $86/hour. To build wealth and reinvest, she needs to charge $110+/hour.
The Project Margin Trap: Why Hourly Rates Aren’t Enough
Knowing your hourly break-even is great, but most service businesses sell projects, not hours. This is where the Contribution Margin comes in.
A $10,000 website project looks profitable until you realize it required $3,000 in subcontractor fees, $500 in stock assets, and 80 hours of your time.
To calculate project break-even, use this formula:
Project Price – Direct Variable Costs = Contribution Margin
If your Contribution Margin is less than the fixed costs allocated to the time it took to complete the project, the project is a loss leader.
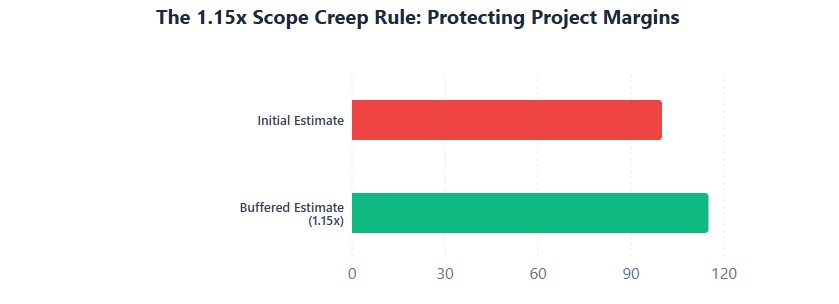
The “Scope Creep” Multiplier: When estimating project break-even, always multiply your estimated hours by 1.15. A 15% buffer for revisions and client feedback is the industry standard for protecting your project margins. If a project is only profitable at 100% efficiency, it is not profitable.
How Your Legal Structure Changes the Math
Your business entity directly impacts your break-even rate because of how taxes are applied. Once your net profit consistently exceeds $80,000, electing S-Corp status (via IRS Form 2553) can drastically lower your break-even threshold.
| Entity Type | Tax Reality | Impact on Break-Even Rate |
|---|---|---|
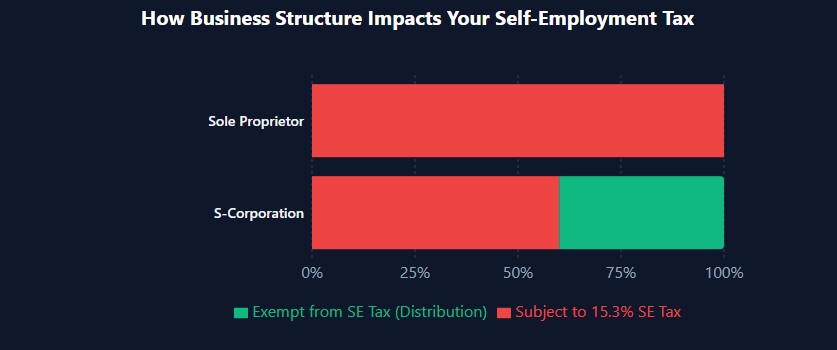
| Sole Proprietor / Single-Member LLC | 15.3% SE tax on all net profit, plus income tax. | Highest break-even rate. You must charge more to cover the full SE tax burden. |
| S-Corporation | 15.3% SE tax applies only to your “reasonable salary.” The rest is distribution (no SE tax). | Lowers break-even rate once profit exceeds ~$80k, as the 1.153x tax multiplier shrinks. |
| Multi-Member LLC / Partnership | Pass-through taxation, but guaranteed payments to partners are subject to SE tax. | Moderate. Depends heavily on the operating agreement and profit distribution. |
Hidden Compliance Triggers That Skew Your Numbers
The IRS and state revenue departments do not care about your break-even spreadsheet, but they do care about how you report the numbers that feed into it. Missteps here can turn a profitable year into an audit nightmare.
- The “Hobby Loss” Rule (IRS Section 183): If your business shows a loss in 3 out of 5 years, the IRS may reclassify it as a hobby and disallow your deductions. Pricing below your true break-even point consistently is a major red flag that invites this scrutiny.
- State Gross Receipts Taxes: In states like Washington (B&O tax) or Texas (Margin Tax), you are taxed on revenue, not just profit. If your project margins are razor-thin, these state taxes can push you below the break-even line, even if your federal return looks fine.
- Under-Allocating Overhead: If you don’t assign a portion of your “fixed” costs (like your CRM subscription or accounting software) to individual projects, you will artificially inflate your project margins by 15% to 20%, leading to disastrous pricing decisions.
Your 4-Step Action Plan
Knowing the formula is useless without execution. Do this today:
- Audit your last 3 months. Look at your actual hours worked vs. hours billed. If your utilization rate is below 60%, your problem isn’t your hourly rate; it’s your lead generation or administrative bloat.
- Run the formula with your real numbers. Plug your target salary, real overhead, and a 70% utilization rate into the formula above. Write that number on a sticky note and put it on your monitor. That is your absolute floor.
- Apply the 1.15x Scope Creep rule. For your next three project proposals, multiply your estimated hours by 1.15 before calculating the price. See how it changes your margin.
- Talk to a CPA about the S-Corp threshold. If your projected net profit is approaching $80,000, ask a tax professional if the administrative cost of an S-Corp election is worth the SE tax savings for your specific state.
Frequently Asked Questions
Q: Should I include health insurance in my fixed costs?
A: Absolutely. If you are buying your own health insurance, it is a non-negotiable business survival cost. It belongs in the “Fixed Costs” line of the formula.
Q: What if my calculated break-even rate is higher than what the market will pay?
A: Then you have a business model problem, not a math problem. You must either increase your perceived value (niche down, improve your portfolio), reduce your fixed costs, or increase your utilization rate by productizing your services to work faster.
Q: Does this formula work for agencies with employees?
A: The core logic remains, but you must calculate the break-even rate per employee role. A junior designer’s “Fixed Cost” includes their salary and benefits, and their utilization rate might be 80%, while a creative director’s utilization rate might only be 40% due to management duties.
Break-even analysis isn’t about survival. It’s about establishing the baseline from which you can actually build wealth. Stop guessing, run the numbers, and price your services with the confidence of a true business owner.