If you run a hybrid business—say, a SaaS company that also offers custom implementation services, or a fitness studio selling both in-person classes and digital subscriptions—you already know the classic break-even formula is practically useless. The traditional model assumes one product and one margin. Reality is messier.
When you juggle diversified revenue streams, relying on a “blended” average margin is a fast track to financial blindness. It masks bleeding segments behind profitable ones, leading to cross-subsidization. Worse, if your cost allocation isn’t documented correctly, you risk IRS pushback under IRC §162 or failing to meet the Debt Service Coverage Ratio (DSCR) requirements for an SBA loan.
Here is the exact, compliance-ready framework to build a break-even model for a hybrid business, complete with the nuanced edge cases most generic guides ignore.
The Core Mechanic: Weighted Average Contribution Margin (WACM)
To find your true break-even point, you must calculate the Weighted Average Contribution Margin (WACM). This accounts for the reality that not all dollars of revenue are created equal. A dollar from a high-margin digital product contributes more to covering your fixed costs than a dollar from a low-margin physical product. For a concise guide to ASC 606 vs IFRS 15 revenue recognition frameworks, see the DualEntry overview: https://www.dualentry.com/blog/revenue-recognition-methods
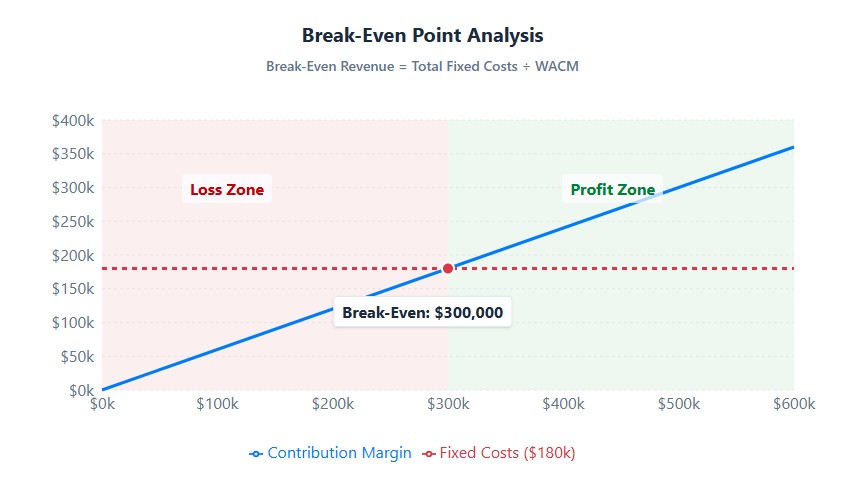
The Formula: Break-Even Revenue = Total Fixed Costs ÷ WACM
To get the WACM, you multiply the contribution margin percentage of each revenue stream by its percentage of total sales, then add them together. But the math is the easy part. The real challenge—and where businesses fail—is accurately defining the variables in that equation.
WACM Calculation Template
Use this structure to calculate your weighted margin. Pull the revenue mix from your accounting software or 1099-K reports, and derive contribution margins from direct cost tracking per stream.
| Revenue Stream | Annual Revenue | Sales Mix % | Variable Cost per $ | Contribution Margin % | Weighted Margin (Mix × CM) |
|---|---|---|---|---|---|
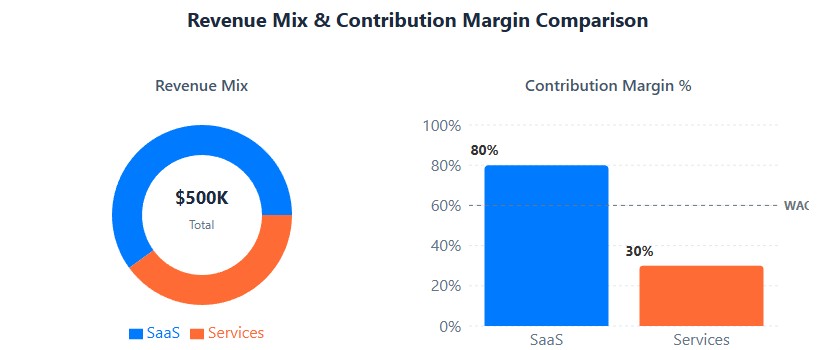
| Stream A (e.g., SaaS) | $300,000 | 60% | $0.20 | 80% | 0.60 × 0.80 = 0.48 |
| Stream B (e.g., Consulting) | $200,000 | 40% | $0.70 | 30% | 0.40 × 0.30 = 0.12 |
| TOTAL | $500,000 | 100% | — | — | WACM = 0.60 (60%) |
If your total fixed costs are $180,000, your break-even revenue is $180,000 ÷ 0.60 = $300,000. Not $500,000. Not a blended average. A precise number you can defend.
The Hidden Trap: The “Blended Margin” Illusion
Imagine a business with $500,000 in total revenue: 60% from software (80% margin) and 40% from consulting (30% margin). A lazy model averages this to a 55% margin. But if the consulting arm requires heavy, fixed salaried labor, that “average” is a lie. The software is subsidizing the consulting. If software sales dip, the entire business collapses, even if total revenue looks stable.
The Fix: You must isolate direct variable costs per stream. For e-commerce, this is COGS and shipping. For services, it’s direct labor and subcontractor fees. If a cost cannot be directly tied to a specific stream, it is a shared fixed cost and must be allocated using a defensible methodology.
Step-by-Step: Building an IRS-Defensible Break-Even Model
Follow this five-step process to build a model that works for internal forecasting and holds up to external scrutiny.
- Isolate Revenue Streams: Pull data from your payment processors (Stripe, Square), 1099-K reports, and accounting software. Do not lump “miscellaneous” income into your primary streams.
- Assign Direct Variable Costs: Map costs that only exist if the sale happens. For a hybrid model, this means separating physical inventory costs from digital hosting fees or payment gateway percentages specific to that channel.
- Allocate Shared Fixed Costs: This is the critical step. For shared expenses (e.g., a $300/mo CRM used for both sales and consulting, or a founder’s salary), you must use a reasonable allocation method. The IRS accepts methods like revenue weighting, headcount, or square footage. For the statutory definition of ordinary and necessary business expenses under IRC § 162(a), see the IRS code summary: https://en.wikipedia.org/wiki/Internal_Revenue_Code_section_162(a). Document this methodology in your accounting notes. If audited, “we just guessed” is not a valid defense.
- Calculate WACM and Break-Even: Apply the formula. Ensure your “Total Fixed Costs” include often-overlooked hybrid expenses: state franchise taxes, economic nexus sales tax software, and multi-entity CPA fees.
- Stress-Test for Debt Service: If you have debt or plan to get an SBA 7(a) loan, your break-even is not zero profit. Lenders typically require a DSCR of 1.25x. You must generate enough contribution margin to cover fixed costs plus 125% of your annual debt service.
Nuances and Edge Cases Competitors Ignore
Standard break-even guides miss the operational realities of running a diversified U.S. business in today’s regulatory environment. Here are three critical adjustments you must make to your model.
1. The ASC 606 Bundled Pricing Complication
If you sell a bundled product (e.g., a $10,000 package including $8,000 of software and $2,000 of onboarding), GAAP (ASC 606) requires you to allocate the transaction price to each distinct performance obligation based on standalone selling prices. Under GAAP ASC 606, bundled transactions must be allocated to distinct performance obligations based on standalone selling prices. For a full revenue recognition standard with Q&As and interpretive guidance, see the KPMG Handbook: https://kpmg.com/us/en/frv/reference-library/2025/handbook-revenue-recognition.html
You cannot just book it all as software revenue. This allocation changes the apparent contribution margin of each stream, which directly impacts your WACM calculation. Your internal model should mirror this allocation to avoid massive forecasting errors. For a step-by-step roadmap to applying ASC 606 (including identifying performance obligations and transaction price), see Deloitte’s guide: https://www.deloitte.com/us/en/services/audit-assurance/articles/a-roadmap-to-applying-the-new-revenue-recognition-standard.html
2. The “Nexus Creep” Fixed Cost
Post-Wayfair, selling digital products or physical goods across state lines triggers economic nexus. This isn’t just about collecting sales tax; it’s about the fixed costs of compliance. Registering in a new state, paying annual franchise taxes (like California’s $800 minimum or Delaware’s $350), and subscribing to multi-state tax filing software (e.g., TaxJar or Avalara) are new fixed costs. For a practical integration of TaxJar for multi-state sales tax with WooCommerce, see the integration doc: https://woocommerce.com/document/taxjar/
If your model doesn’t add $1,500–$3,000 in annual compliance overhead per new nexus state, your break-even point is artificially low.
3. The Free Trial and Onboarding Cost Sink
For hybrid SaaS/service businesses, the cost of onboarding a client is often treated as a Customer Acquisition Cost (CAC) and expensed immediately under IRC §162. However, if that onboarding is a mandatory part of the service, it drags down the contribution margin of the initial sale. Your model must account for the fact that a new customer might be negative margin in month one, requiring a higher volume of retained subscriptions to reach true break-even.
Full Numeric Case Study: Hybrid SaaS + Services Business
Let’s walk through a real-world scenario to see how this works end-to-end. This is a Delaware-registered hybrid business selling SaaS subscriptions and professional services.
The Inputs
- Annual Revenue: $500,000
- Revenue Mix: 60% SaaS ($300k), 40% Services ($200k)
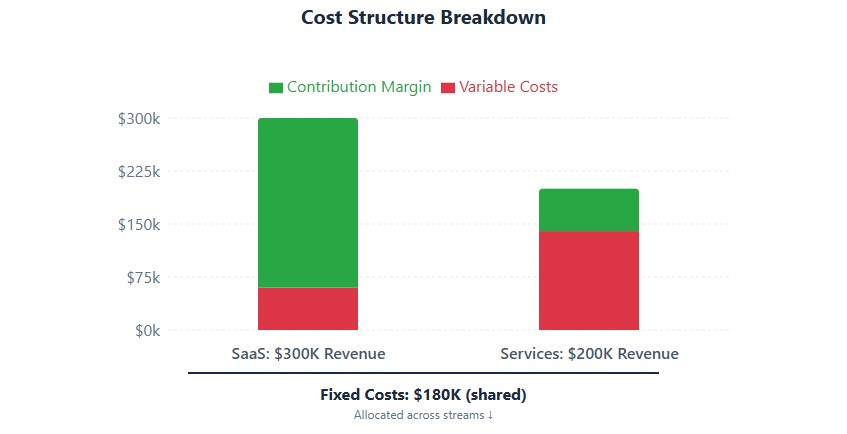
- SaaS Variable Costs: Hosting, payment processing, customer support labor = $60k (20% of SaaS revenue)
- Services Variable Costs: Contractor fees, project-specific software = $140k (70% of services revenue)
- Shared Fixed Costs: $180,000 (rent, founder salary, CRM, insurance, Delaware franchise tax, multi-state tax software, CPA fees)
The WACM Calculation
| Stream | Revenue | Variable Cost | Contribution Margin | CM % | Sales Mix % | Weighted Margin |
|---|---|---|---|---|---|---|
| SaaS | $300,000 | $60,000 | $240,000 | 80% | 60% | 0.60 × 0.80 = 0.48 |
| Services | $200,000 | $140,000 | $60,000 | 30% | 40% | 0.40 × 0.30 = 0.12 |
| Total | $500,000 | $200,000 | $300,000 | — | 100% | WACM = 0.60 |
The Break-Even Result
Break-Even Revenue = $180,000 ÷ 0.60 = $300,000
This means the business needs $300,000 in annual revenue to cover all fixed and variable costs. At the current $500,000 run rate, the business is generating $120,000 in profit ($300,000 × 0.60 contribution – $180,000 fixed costs).
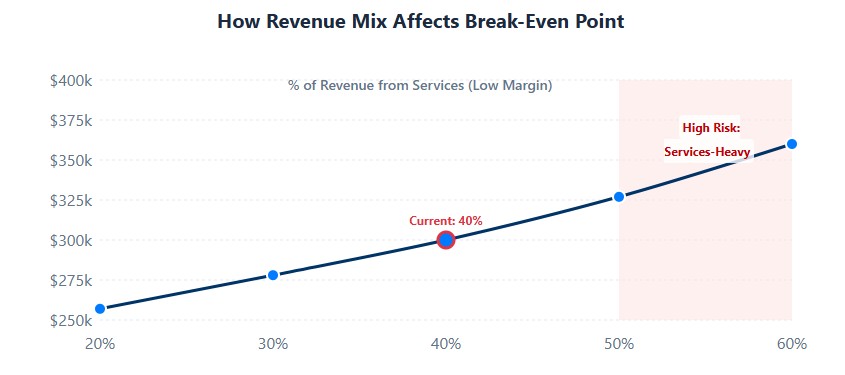
The Trap: If the founder had used a blended margin of 60% across the board without isolating streams, they’d get the same answer by luck. But if the services mix shifts to 50% of revenue (perhaps due to a SaaS slowdown), the WACM drops to 0.55, and break-even jumps to $327,272. A 10% mix shift creates a $27,000 revenue gap. That’s the kind of insight only stream-level modeling reveals.
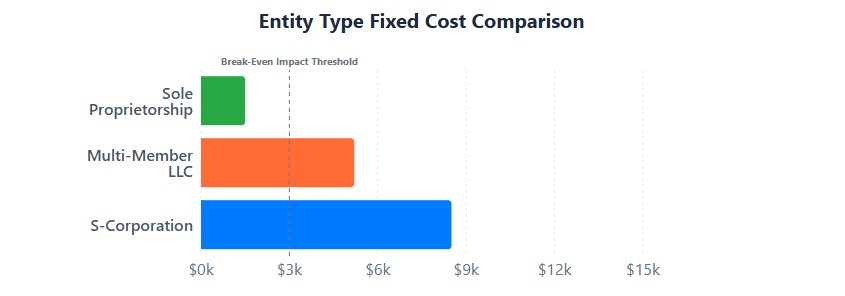
Entity Structure Impact on Your Break-Even Point
Your legal structure dictates your baseline fixed costs. A model built for a Sole Proprietorship will fail if you operate as a Multi-Member LLC or S-Corp, due to payroll taxes, franchise fees, and filing requirements.
| Entity Type | Key Fixed Cost Additions | Impact on Break-Even Model |
|---|---|---|
| Sole Proprietorship | 15.3% Self-Employment Tax on net earnings. | Lower administrative fixed costs, but higher variable tax drag on profit. |
| S-Corporation | Payroll processing, Form 941 filings, reasonable salary requirement. | Higher baseline fixed costs (payroll admin), but lower overall tax burden at scale, lowering the true cash break-even. |
| Multi-Member LLC | State franchise/annual report fees, complex K-1 preparation. | Must allocate profits/losses per operating agreement, requiring stream-specific tracking for accurate K-1 reporting. |
For guidance on SBA small business resources and debt service considerations, see the SBA 2024 Small Business Resource Guide: https://www.bastropedc.org/media/userfiles/subsite_157/files/resource-library/2024%20SBA%20National%20Small%20Business%20Resourc
Actionable Next Steps for Hybrid Founders
Do not let your accounting software do the thinking for you. Default “Profit and Loss” statements blend everything together. To gain control, take these immediate steps:
- Enable Class or Location Tracking: In QuickBooks Online or Xero, turn on class tracking immediately. Assign every single expense and invoice to a specific revenue stream. This automates the WACM data collection.
- Document Your Allocation Method: Write a one-page internal memo detailing how shared costs (rent, software, management salaries) are split between your business lines. Have your CPA review it. This is your primary audit defense.
- Reconcile 1099-Ks Monthly: Ensure the revenue reported by your payment processors matches the revenue allocated in your books. Discrepancies here are the number one trigger for IRS automated notices.
- Run a “Kill/Keep” Analysis: If a specific revenue stream has a contribution margin below 30% after direct costs, and it requires significant shared resources, your model will show it is destroying value. Use this data to raise prices, cut the stream, or restructure the offering.
Break-even modeling for a hybrid business is not about finding a single magic number. It is about building a transparent, defensible system that tells you exactly which parts of your business are carrying the weight, and which parts are dead weight. Get the allocation right, and you will not only protect yourself from compliance risks, but you will also have the clarity needed to scale profitably.