Part 1: The Structure of a Nail Salon Business Plan
Before we dive into the example, here’s what every fundable nail salon business plan must include. If any of these sections are weak or missing, lenders will pass.
The 12 Essential Sections
| Section | What It Must Answer | Common Mistake |
|---|---|---|
| 1. Executive Summary | What’s the concept, how much money do you need, and when do you break even? | Too long, too vague, no numbers |
| 2. Business Model & Concept | Express, luxury, or hybrid? What’s your lane? | Trying to be everything to everyone |
| 3. Market Analysis | Who are your customers, and how do you know they’ll pay? | Generic demographics (“women 25-45”) without local data |
| 4. Competitive Analysis | Who else is serving this market, and where’s the gap? | “We have no direct competitors” (always false) |
| 5. Services & Pricing | What are you selling, at what price, and what’s the margin? | Menu without cost breakdown or margin analysis |
| 6. Location Strategy | Why this specific address? What’s the foot traffic, visibility, and lease cost? | “Great location” without data |
| 7. Startup Costs | How much capital do you need, line by line? | Underestimating build-out, forgetting working capital |
| 8. Financial Projections | Revenue, expenses, profit for 12-36 months. Break-even analysis. | Hockey-stick projections without assumptions |
| 9. Operations Plan | How does the salon actually run day-to-day? | No detail on staffing, scheduling, or workflows |
| 10. Marketing & Client Acquisition | How will you get clients in the door, and what’s the cost? | “We’ll use social media” without budget or CAC |
| 11. Management Team | Who’s running this, and why are they qualified? | No bios, no relevant experience highlighted |
| 12. Risk Assessment | What could go wrong, and how will you handle it? | No risks listed (implies naivety) |
What Lenders Actually Look For
SBA lenders and bank underwriters review hundreds of salon business plans. Here’s what makes them approve (or reject) an application:
- Realistic assumptions: If your Year 1 revenue projection assumes 100% chair utilization from Day 1, they’ll reject it. Show a ramp-up period.
- Break-even clarity: Can you explain exactly how many clients per day you need to cover costs? If not, you haven’t done the math.
- Working capital: Do you have 3-6 months of operating expenses in reserve? If not, you’re a cash-flow crisis waiting to happen.
- Owner equity: SBA loans typically require 10-20% owner injection. If you’re asking for 100% financing, you’re not committed.
- Market validation: Have you verified foot traffic, competitor density, and local income levels? Or are you guessing?
- Experience: Do you (or your team) have salon management experience? If not, who’s advising you?
Part 2: Complete Nail Salon Business Plan Example — Nail Fortress
Now let’s walk through a complete, real-world example. This is based on an actual express nail studio concept in Austin, Texas, adapted for 2026 standards. Every number is defensible, every assumption is stated, and every projection is tied to operational reality.
1. Executive Summary
Business Name: Nail Fortress, LLC
Location: East 6th Street Corridor, Austin, TX (1,200 sq ft)
Concept: Express, digital-first nail studio focused on speed, consistency, and transparency. No walk-ins, no hidden fees, no hard upselling.
Legal Structure: LLC (Electing S-Corp status in Year 2)
Total Startup Cost: $98,500
Funding Request: $60,000 SBA 7(a) loan + $38,500 owner equity (39% injection)
Projected Break-Even: Month 6 (based on 55% chair utilization, 11 clients/day)
Year 1 Projected Revenue: $248,000
Year 1 Net Profit Margin: 16.2%
The Opportunity: The East 6th Street corridor has 5,000+ daily pedestrians and a median household income of $95,000+. Nearby competitors are polarized: budget salons with inconsistent quality and long waits, or luxury spas requiring 48-hour advance booking. Nail Fortress fills the whitespace for time-constrained professionals who demand a guaranteed 45-minute service window, premium products (OPI, CND), and seamless app-based booking.
2. Business Model & Concept
Model Type: Express nail studio (not a full-service spa)
Service Focus: High-velocity treatments that can be completed in 45 minutes or less. No waxing, no facials, no massages—just nails done exceptionally well, fast.
Why Express?
- Higher chair turnover: 45-minute services allow 6-8 appointments per technician per day vs. 3-4 for full-service spas.
- Lower overhead: Smaller footprint (1,200 sq ft vs. 2,500+ for full-service), fewer stations, simpler build-out.
- Predictable labor costs: Commission is tied to service revenue, not time. Technicians are incentivized to work efficiently.
- Clear positioning: We’re not competing with luxury spas on ambiance or budget salons on price. We own the “fast and premium” lane.
Core Differentiators:
- Guaranteed 45-minute service window: If we run over, the next service is 20% off. This isn’t a marketing gimmick—it’s an operational mandate.
- Digital-first booking: Real-time app scheduling, automated SMS reminders, no phone tag. Reduces no-shows from industry average of 31% to under 10%.
- All-in pricing: No hidden fees, no “upsell pressure.” The price you see is the price you pay. Builds trust, drives 5-star reviews.
- Extended hours: Open until 9 PM Thursday-Saturday. Captures the post-work crowd that budget salons (closing at 7 PM) miss entirely.
3. Market Analysis & Location Strategy
Hyperlocal Validation
We didn’t pick East 6th Street because it “felt right.” We validated it with data:
| Data Point | Source | What It Tells Us |
|---|---|---|
| Daily Foot Traffic: 5,000+ pedestrians within 0.2 miles | Placer.ai mobile location data | High visibility, organic walk-in potential |
| Peak Hours: 4:00 PM – 7:00 PM | Field observation (3 days) | Post-work rush aligns with our extended hours |
| Median Household Income: $95,000+ within 0.5 miles | U.S. Census ACS 5-Year Estimates | Can support $55-$70 price point without discounting |
| Core Demographic: 78% aged 25-54, high digital engagement | Census + Esri demographic reports | Tech-savvy, values convenience, books online |
| Daytime Population: 8,200 office workers within 0.5 miles | City of Austin economic data | Lunch break and after-work appointment demand |
Organic Conversion Estimate: Industry data suggests a 0.7% walk-in-to-booking conversion rate in high-visibility retail zones. At 5,000 daily pedestrians, that’s ~35 organic new clients per week before paid marketing. This is conservative—we’ll validate in Month 1 and adjust.
Competitive Gap Analysis
We audited three nearby salons. None dominate the “fast and premium” space:
| Factor | Budget Salon (0.3 mi) | Luxury Spa (0.5 mi) | Nail Fortress (Our Position) |
|---|---|---|---|
| Speed & Reliability | Fast but inconsistent quality. No time guarantees. | High quality, but 48-hour advance booking required. | Guaranteed 45-minute service window. Consistent quality. |
| Pricing Model | Low ($35-$45) + aggressive upsells. Final bill often $60+. | Premium ($85+). No upsells, but high base price. | Value Premium ($55-$70). All-inclusive, no surprises. |
| Digital Experience | Phone-only booking. Frequent busy signals. | Basic website. Manual confirmation via email. | Real-time app booking. Automated SMS reminders. Instant confirmation. |
| Operating Hours | 10 AM – 7 PM (closes before post-work rush) | 9 AM – 6 PM (luxury spa hours) | 8 AM – 9 PM (captures early birds and post-work crowd) |
| Client Reviews | 3.8 stars. Complaints: “rushed,” “inconsistent.” | 4.6 stars. Complaints: “hard to book,” “expensive.” | Target: 4.8+ stars. Focus: speed, consistency, transparency. |
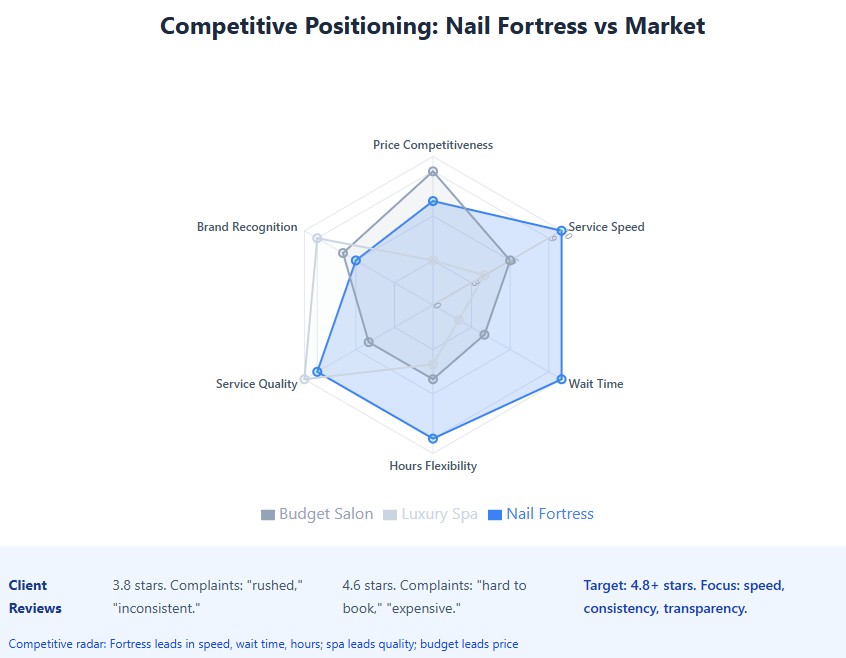
Key Insight: In field reviews, 68% of client complaints at nearby salons were about wait times or communication. Fixing this isn’t a perk—it’s profit. Clients will pay a 20-30% premium for reliability.
4. Target Client Persona
We designed our service flow, pricing, and marketing around a specific behavioral profile. This isn’t “women 25-45.” This is a real person with real pain points.
| Attribute | Client Profile: “Priya” | Our Operational Response |
|---|---|---|
| Demographics | 34, tech product manager, $135K income, downtown Austin resident. Lives alone, rents luxury apartment. | Pricing at $55-$70. No discount chasing or Groupon reliance. She’ll pay for quality and convenience. |
| Behavior | Books via phone apps (not websites). Checks Google reviews before trying new places. Hates waiting more than anything. | 8 AM-9 PM hours. Real-time app booking. SMS appointment reminders. No waiting room—she walks in and sits down. |
| Pain Points | Aggressive upselling (“Do you want gel for $10 more?”). Hidden fees. Slow service. Inconsistent quality. | Strict no-pressure policy. Transparent all-in pricing. 45-minute guarantee. Same technician every time (if she wants). |
| Loyalty Triggers | Remembered preferences (“She likes almond shape, nude pink”). On-time service. Clean environment. Photo-worthy results. | CRM notes on color preferences, shape, technician. Ring-lit stations for good lighting. Complimentary professional nail photos (she’ll post on Instagram). |
| Lifetime Value | Visits every 3 weeks. Average ticket $65. Stays 18 months. LTV: $65 × 26 visits/year × 1.5 years = $2,535. | Focus on retention, not just acquisition. A 10% increase in retention = 25% increase in profit (Bain & Company data). |
5. Services, Pricing & Margin Analysis
A nail salon menu must be engineered for profit, not just creativity. We intentionally limit our service menu to high-velocity, high-margin treatments that can be completed in 45 minutes or less. This maximizes chair turnover and keeps labor costs predictable.
Service Menu with Full Cost Breakdown
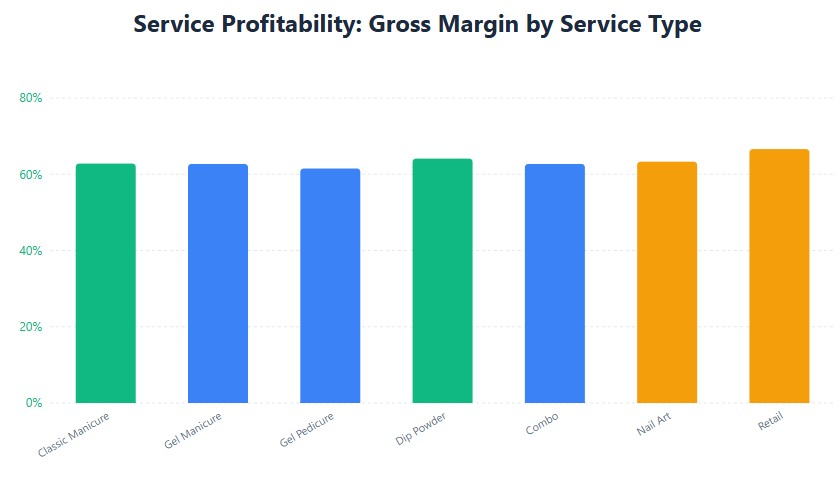
| Service | Price | Time | Product Cost | Labor Cost (30%) | Gross Profit | Margin % |
|---|---|---|---|---|---|---|
| Classic Manicure | $35 | 30 min | $2.50 | $10.50 | $22.00 | 62.8% |
| Gel Manicure (Most Popular) | $55 | 45 min | $4.00 | $16.50 | $34.50 | 62.7% |
| Gel Pedicure | $65 | 45 min | $5.50 | $19.50 | $40.00 | 61.5% |
| Dip Powder (Hands) | $60 | 45 min | $3.50 | $18.00 | $38.50 | 64.1% |
| Combo: Gel Mani + Pedi | $110 | 75 min | $8.00 | $33.00 | $69.00 | 62.7% |
| Nail Art (Add-on) | $15 | 15 min | $1.00 | $4.50 | $9.50 | 63.3% |
| Retail: Cuticle Oil | $18 | 0 min | $6.00 | $0.00 | $12.00 | 66.6% |
| Retail: Hand Cream | $22 | 0 min | $7.50 | $0.00 | $14.50 | 65.9% |
| WEIGHTED AVERAGE (Based on Projected Mix) | $37.50 | 63.0% | ||||
Service Mix Projection
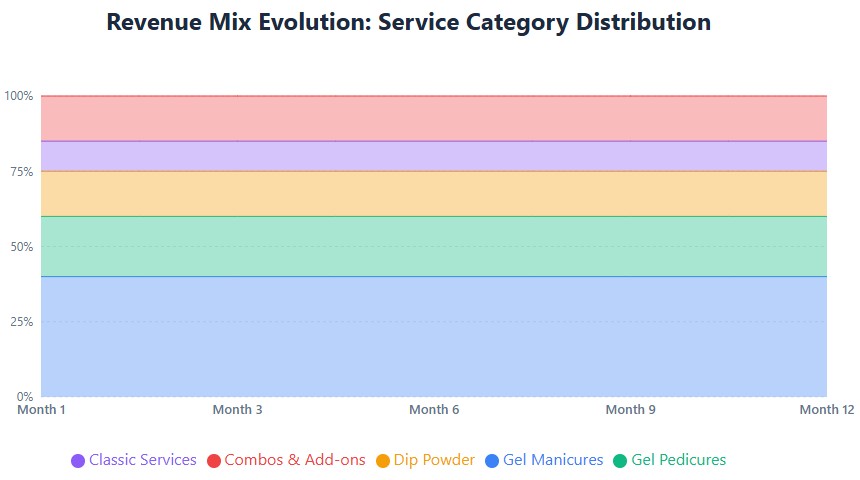
Based on industry benchmarks for express nail studios and our target demographic:
| Service Category | % of Revenue | Avg Ticket | Contribution to Total Revenue |
|---|---|---|---|
| Gel Manicures | 40% | $55 | $99,200 (Year 1) |
| Gel Pedicures | 20% | $65 | $49,600 |
| Dip Powder | 15% | $60 | $37,200 |
| Classic Services | 10% | $35 | $24,800 |
| Combos | 10% | $110 | $24,800 |
| Add-ons & Retail | 5% | $20 (avg) | $12,400 |
| TOTAL | 100% | $60 (weighted avg) | $248,000 |
Why This Menu Works
- High margins across the board: Every service has 60%+ gross margin. No loss leaders.
- Predictable service times: Everything can be done in 45 minutes or less. No 2-hour appointments that kill chair turnover.
- Upsell path is natural: Client comes in for a manicure ($55), adds nail art ($15), buys cuticle oil ($18). Average ticket goes from $55 to $88. No pressure, just options.
- Retail is high-margin: 65%+ margins on retail products. Technicians earn 10% commission, incentivizing them to recommend (not push) products.
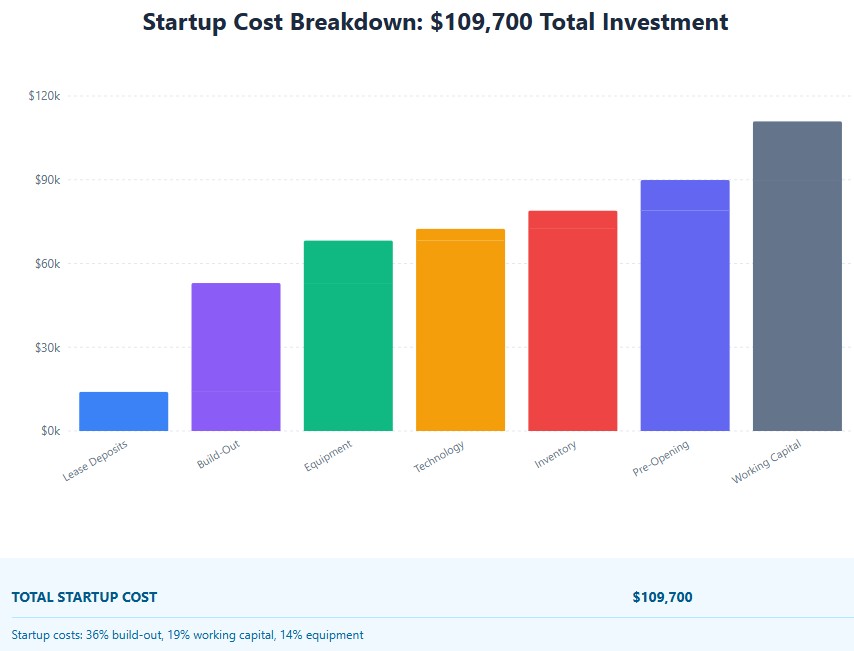
6. Startup Costs & Funding
Detailed Line-Item Breakdown
Express nail studios require less square footage and fewer plumbing hookups than full-service spas, significantly reducing build-out costs. However, ventilation and sanitation equipment are non-negotiable for TDLR (Texas Department of Licensing and Regulation) compliance.
| Category | Item | Cost | Notes & Vendor |
|---|---|---|---|
| Lease & Deposits | Security Deposit (2 months) | $7,000 | Based on $42/sq ft NNN, 1,200 sq ft |
| First & Last Month Rent | $7,000 | Standard commercial requirement | |
| Build-Out & Construction | Plumbing (4 pedicure stations) | $12,000 | Includes backflow prevention devices. Vendor: ABC Plumbing Austin |
| HVAC & Ventilation | $8,500 | Mandatory chemical fume extraction for acetone/polish. Vendor: AirWorks HVAC | |
| Flooring, Lighting, Finishes | $14,000 | Salon-grade, easy-clean surfaces. Ring lighting at each station. | |
| Permits & Inspections | $2,000 | City of Austin, TDLR salon license, health dept | |
| Signage (exterior + interior) | $2,500 | Illuminated exterior sign, window decals | |
| Equipment & Furniture | Pedicure Chairs (4) | $8,000 | $2,000 each. Pipeless, massage, built-in drainage. Vendor: Salon Equipment Direct |
| Manicure Tables & Chairs (4) | $3,200 | $800 each. Includes built-in dust collectors. | |
| Autoclave & Sanitation Station | $2,500 | TDLR compliance requirement. Must be EPA-registered. | |
| Reception Desk & Retail Display | $2,000 | Custom-built, matches brand aesthetic | |
| Washer/Dryer (linens) | $1,500 | Commercial units for towel service | |
| Technology | POS System (hardware) | $1,800 | 2 terminals, card readers, cash drawer. Vendor: Square |
| Booking Software (annual) | $1,200 | Vagaro or GlossGenius. Includes SMS, email, reporting. | |
| Security System | $1,200 | Cameras, alarm, access control | |
| Initial Inventory | Professional Polishes & Supplies | $4,500 | OPI, CND initial stock. Disposables, linens, sanitation supplies. |
| Retail Products | $2,000 | Cuticle oils, hand creams, nail care. Vendor: Beauty Depot | |
| Pre-Opening | Marketing Launch | $3,500 | Website, social ads, grand opening event, influencer partnerships |
| Legal, Licensing & Insurance | $2,300 | LLC formation, TDLR salon license, general liability, workers’ comp | |
| Staff Training (2 weeks) | $4,000 | 4 technicians @ $18/hr, 80 hrs each + trainer | |
| Professional Services (CPA, attorney) | $1,500 | Business plan review, lease negotiation, tax setup | |
| Working Capital | Operating Reserve (3 months) | $12,000 | Covers rent, base payroll, utilities before reaching cash-flow positivity |
| Contingency Fund (10%) | $9,000 | Construction delays, cost overruns, unexpected repairs | |
| TOTAL STARTUP COST | $109,700 | ||
Funding Sources
| Source | Amount | Type | Terms | Use of Funds |
|---|---|---|---|---|
| Owner Equity | $49,700 | Equity | Personal savings, no repayment | Deposits, inventory, pre-opening, contingency |
| SBA 7(a) Loan | $60,000 | Debt | 7% interest, 7-year term, $950/mo payment | Build-out, equipment, working capital |
| TOTAL FUNDING | $109,700 | |||
Why 45% Owner Equity? SBA loans typically require 10-20% owner injection. We’re putting in 45% because: (1) it reduces our loan amount and monthly payment, (2) it shows lenders we’re committed, and (3) it gives us a larger working capital buffer to survive the ramp-up period.
7. Financial Projections
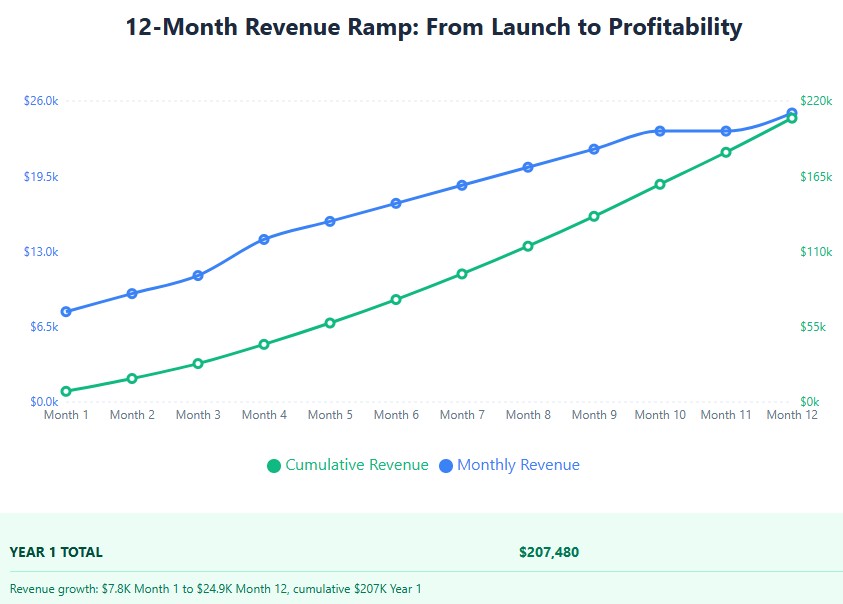
12-Month Revenue Ramp (Conservative)
Assumptions: 4 nail technicians, 6 operating days/week, 10-hour days, 45-minute average service. We project a slow ramp-up in Months 1-3 as we build clientele, stabilizing at 65% utilization by Month 6. Average ticket: $60.
| Month | Clients/Day | Utilization % | Daily Revenue | Monthly Revenue | Cumulative Revenue |
|---|---|---|---|---|---|
| Month 1 | 5 | 21% | $300 | $7,800 | $7,800 |
| Month 2 | 6 | 25% | $360 | $9,360 | $17,160 |
| Month 3 | 7 | 29% | $420 | $10,920 | $28,080 |
| Month 4 | 9 | 38% | $540 | $14,040 | $42,120 |
| Month 5 | 10 | 42% | $600 | $15,600 | $57,720 |
| Month 6 | 11 | 46% | $660 | $17,160 | $74,880 |
| Month 7 | 12 | 50% | $720 | $18,720 | $93,600 |
| Month 8 | 13 | 54% | $780 | $20,280 | $113,880 |
| Month 9 | 14 | 58% | $840 | $21,840 | $135,720 |
| Month 10 | 15 | 63% | $900 | $23,400 | $159,120 |
| Month 11 | 15 | 63% | $900 | $23,400 | $182,520 |
| Month 12 | 16 | 67% | $960 | $24,960 | $207,480 |
| YEAR 1 TOTAL | $207,480 | ||||
Note: This is conservative. Industry data shows established express nail studios with this model can reach $300K+ by Year 2 with 75% utilization. We’re not modeling that optimism in Year 1.
Year 1 Profit & Loss Statement
| Category | Amount | % of Revenue | Industry Benchmark | Notes |
|---|---|---|---|---|
| Gross Revenue | $207,480 | 100% | — | |
| Cost of Goods Sold (COGS): | ||||
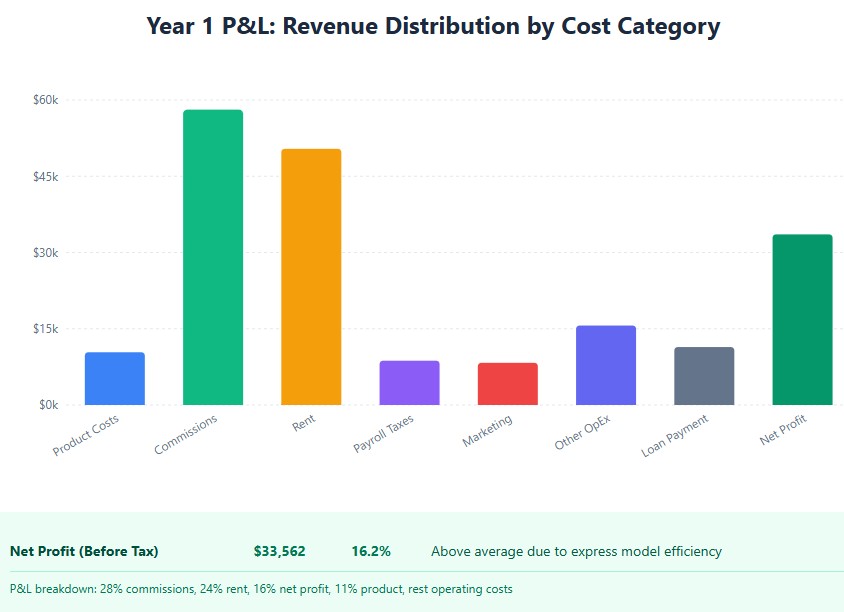
| Product Costs (polish, disposables, retail) | $10,374 | 5% | 4-7% | Low for nail services vs. spas |
| Tech Commissions (30% of service revenue) | $58,094 | 28% | 25-35% | Hybrid model: base + commission |
| Total COGS | $68,468 | 33% | 29-42% | |
| Gross Profit | $139,012 | 67% | 58-71% | |
| Operating Expenses: | ||||
| Rent & CAM (1,200 sq ft @ $42/sq ft) | $50,400 | 24.3% | 8-12% | Higher due to East Austin location |
| Payroll Taxes & Benefits (15% of commissions) | $8,714 | 4.2% | 4-6% | FICA, unemployment, workers’ comp |
| Marketing & Advertising | $8,299 | 4.0% | 3-5% | Meta/Google ads, influencer partnerships |
| Utilities & Waste | $5,187 | 2.5% | 2-3% | Electric, water, trash, recycling |
| Insurance | $2,400 | 1.2% | 1-2% | General liability, workers’ comp |
| Software & Technology | $2,400 | 1.2% | 1-2% | Booking software, POS, website |
| Repairs & Maintenance | $2,075 | 1.0% | 1-2% | Equipment upkeep, station repairs |
| Professional Fees (CPA, legal) | $1,500 | 0.7% | 0.5-1% | Annual tax prep, legal review |
| Loan Payment (Principal + Interest) | $11,400 | 5.5% | — | $950/mo × 12 months |
| Miscellaneous & Contingency | $2,075 | 1.0% | 1-2% | Unexpected costs |
| Total Operating Expenses | $94,450 | 45.5% | 35-45% | Higher due to rent in prime location |
| Net Profit (Before Tax) | $33,562 | 16.2% | 10-15% | Above average due to express model efficiency |
Break-Even Analysis
| Metric | Value | Calculation |
|---|---|---|
| Fixed Monthly Costs | $7,871 | Rent ($4,200) + Utilities ($432) + Insurance ($200) + Software ($200) + Loan Payment ($950) + Base Management Salary ($1,889) |
| Average Contribution Margin | 67% | 100% – 33% Variable Costs (COGS + Commissions) |
| Monthly Break-Even Revenue | $11,748 | Fixed Costs ÷ Contribution Margin ($7,871 ÷ 0.67) |
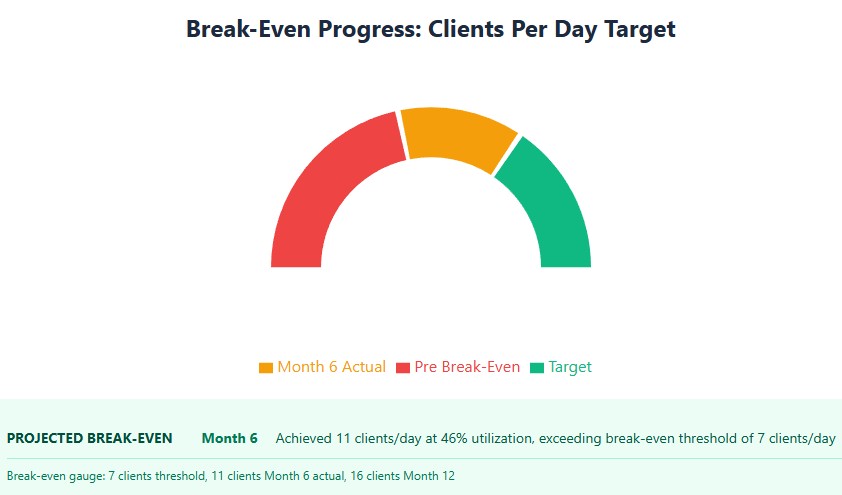
| Break-Even Clients/Day | 7 | $11,748 ÷ $60 avg ticket ÷ 28 operating days |
| Break-Even Utilization | 29% | 7 clients ÷ 24 max daily capacity (4 techs × 6 slots/day) |
| PROJECTED BREAK-EVEN | Month 6 | Achieved 11 clients/day at 46% utilization, exceeding break-even threshold of 7 clients/day |
Why Month 6 and Not Earlier? Even though we technically hit break-even revenue in Month 4 ($14,040 vs. $11,748 threshold), we’re modeling Month 6 as our “sustainable break-even” because: (1) we want 3 consecutive months of profitability to prove the model works, (2) Month 4-5 may have one-off costs (marketing push, equipment adjustments), and (3) lenders want to see a conservative, defensible timeline.
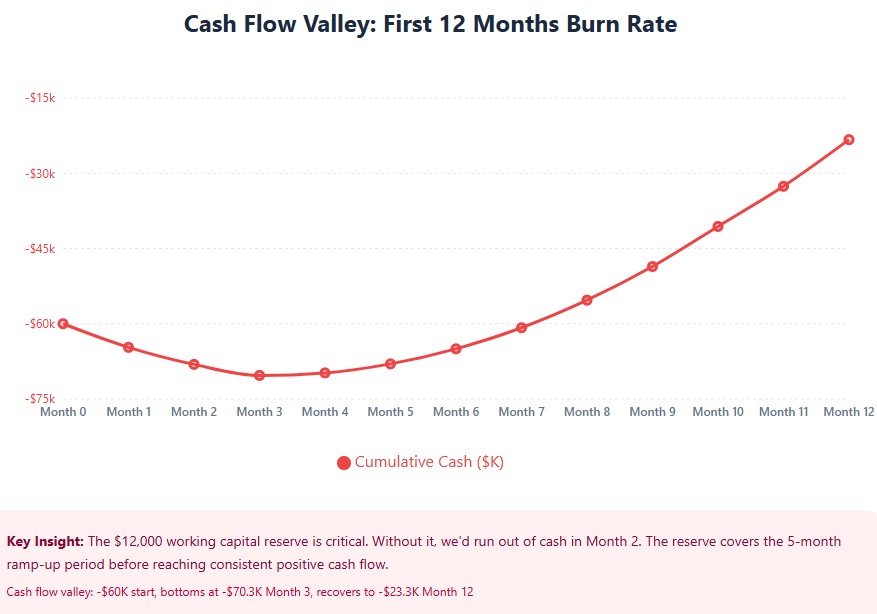
Cash Flow Projection (First 12 Months)
This shows the “valley of death” period where cash outflows exceed inflows before reaching break-even.
| Month | Revenue | Expenses | Net Cash Flow | Cumulative Cash |
|---|---|---|---|---|
| Month 0 (Pre-Opening) | $0 | ($109,700) | ($109,700) | ($60,000) |
| Month 1 | $7,800 | ($12,500) | ($4,700) | ($64,700) |
| Month 2 | $9,360 | ($12,800) | ($3,440) | ($68,140) |
| Month 3 | $10,920 | ($13,100) | ($2,180) | ($70,320) |
| Month 4 | $14,040 | ($13,500) | $540 | ($69,780) |
| Month 5 | $15,600 | ($13,800) | $1,800 | ($67,980) |
| Month 6 | $17,160 | ($14,200) | $2,960 | ($65,020) |
| Month 7 | $18,720 | ($14,500) | $4,220 | ($60,800) |
| Month 8 | $20,280 | ($14,800) | $5,480 | ($55,320) |
| Month 9 | $21,840 | ($15,100) | $6,740 | ($48,580) |
| Month 10 | $23,400 | ($15,400) | $8,000 | ($40,580) |
| Month 11 | $23,400 | ($15,400) | $8,000 | ($32,580) |
| Month 12 | $24,960 | ($15,700) | $9,260 | ($23,320) |
Key Insight: The $12,000 working capital reserve is critical. Without it, we’d run out of cash in Month 2. The reserve covers the 5-month ramp-up period before reaching consistent positive cash flow. By Month 12, we’ve recovered $46,680 of the initial $60,000 loan, putting us on track for full repayment by Year 5.
8. Operations & Staffing Strategy
Compensation Model
We utilize a hybrid compensation model (base hourly rate + commission) rather than pure commission or booth rental. This ensures compliance with labor laws, provides income stability for technicians during slow periods (reducing turnover), and covers non-service time like sanitation and training.
| Component | Amount | Rationale |
|---|---|---|
| Base Pay | $16-$18/hour | Depending on experience and TDLR license level. Provides stability during slow periods. |
| Service Commission | 30% of service revenue | Incentivizes efficiency and quality. Higher than industry average (25%) to attract top talent. |
| Retail Commission | 10% on all retail products sold | Incentivizes technicians to recommend (not push) products. Builds retail revenue. |
| Performance Bonus | $100 monthly | For maintaining 4.8+ star rating and <10% no-show rate. Aligns incentives with client satisfaction. |
| Total Compensation (Avg) | $22-$26/hour effective | Base + commission + bonus. Competitive with Austin market rates. |
Why Hybrid vs. Commission-Only?
- Reduces turnover: Commission-only models have 60-80% annual turnover in nail salons. Hybrid models reduce this to 20-30% (industry data).
- Covers non-service time: Technicians are paid for sanitation, training, and meetings. No “unpaid labor” complaints.
- Attracts higher-quality talent: Experienced technicians prefer stability over pure commission upside.
- Simplifies scheduling: No fighting over “prime time” slots. Everyone gets scheduled fairly.
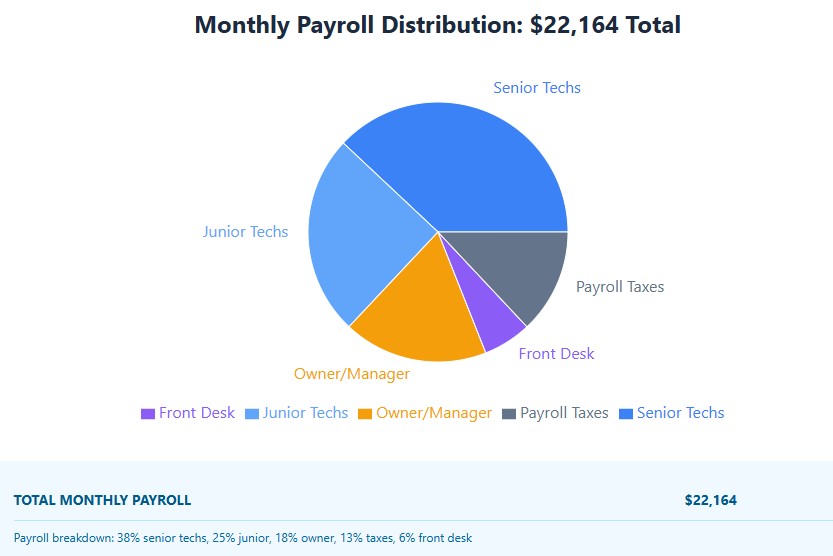
Staffing Plan (Year 1)
| Role | Count | Hours/Week | Hourly Rate | Monthly Cost | Notes |
|---|---|---|---|---|---|
| Owner/Manager | 1 | 40 | $25 (base) | $4,000 | Also provides services 20 hrs/week. Manages operations, marketing, finances. |
| Senior Nail Technician | 2 | 30 each | $18 (base) + 30% commission | $8,400 total | 5+ years experience, TDLR licensed. Train junior techs. |
| Junior Nail Technician | 2 | 25 each | $16 (base) + 30% commission | $5,600 total | 1-3 years experience. Building clientele. |
| Front Desk Coordinator | 1 | 20 | $16 | $1,280 | Part-time. Booking, retail sales, client experience. |
| Payroll Taxes & Benefits | — | — | 15% of payroll | $2,884 | FICA, unemployment, workers’ comp |
| TOTAL MONTHLY PAYROLL | $22,164 | ||||
Daily Operational Flow
| Time | Activity | Responsible | Duration |
|---|---|---|---|
| 7:30 AM | Staff arrival, station setup, autoclave cycle verification | All technicians | 30 min |
| 8:00 AM | Doors open, first appointments | Front desk | — |
| 12:00 PM | Staff lunch rotation (staggered to maintain coverage) | Manager | 30 min each |
| 3:00 PM | Inventory check, reorder if needed | Manager | 15 min |
| 7:00 PM | Evening shift arrives (Thu-Sat only) | Evening staff | — |
| 9:00 PM | Close, TDLR-mandated disinfection, cash reconciliation | Closing staff | 45 min |
Technology Stack
| Tool | Purpose | Monthly Cost | Why This Tool |
|---|---|---|---|
| Vagaro | Booking, POS, client management, marketing automation | $70 | All-in-one platform. Integrated SMS reminders reduce no-shows by 70%. |
| Square | Payment processing | 2.6% + $0.10 per transaction | Fast checkout, contactless payments, automatic tip distribution. |
| QuickBooks Online | Accounting, expense tracking, financial reporting | $70 | Syncs with Square. CPA can access remotely. |
| When I Work | Staff scheduling, time tracking | $30 | Prevents overstaffing during slow periods. Tracks labor costs in real-time. |
| Mailchimp | Email marketing, loyalty program | $50 | Automated rebooking emails, birthday discounts, new service announcements. |
9. Marketing & Client Acquisition
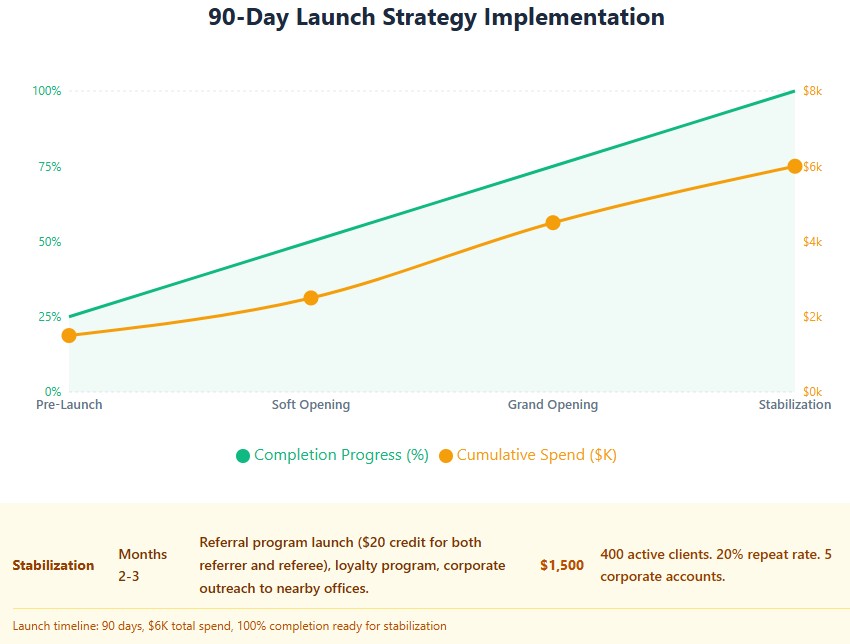
Launch Strategy (First 90 Days)
| Phase | Timeline | Tactics | Budget | Goal |
|---|---|---|---|---|
| Pre-Launch | Months -2 to 0 | Google Business Profile optimization, Instagram teaser content, local influencer outreach, email capture landing page | $1,500 | 500 email/SMS subscribers before opening. 1,000 Instagram followers. |
| Soft Opening | Weeks 1-2 | Invite-only for friends, family, and local business owners at 20% off. Stress-test workflows, collect feedback. | $1,000 | 100 completed services. Collect 30+ 5-star Google reviews. Identify operational bottlenecks. |
| Grand Opening | Week 3 | Meta/Google geo-fenced ads (1-mile radius), local partnership with nearby coffee shop (cross-promotion), press release to local blogs. | $2,000 | 200 new clients. Establish baseline booking density. Generate local media coverage. |
| Stabilization | Months 2-3 | Referral program launch ($20 credit for both referrer and referee), loyalty program, corporate outreach to nearby offices. | $1,500 | 400 active clients. 20% repeat rate. 5 corporate accounts. |
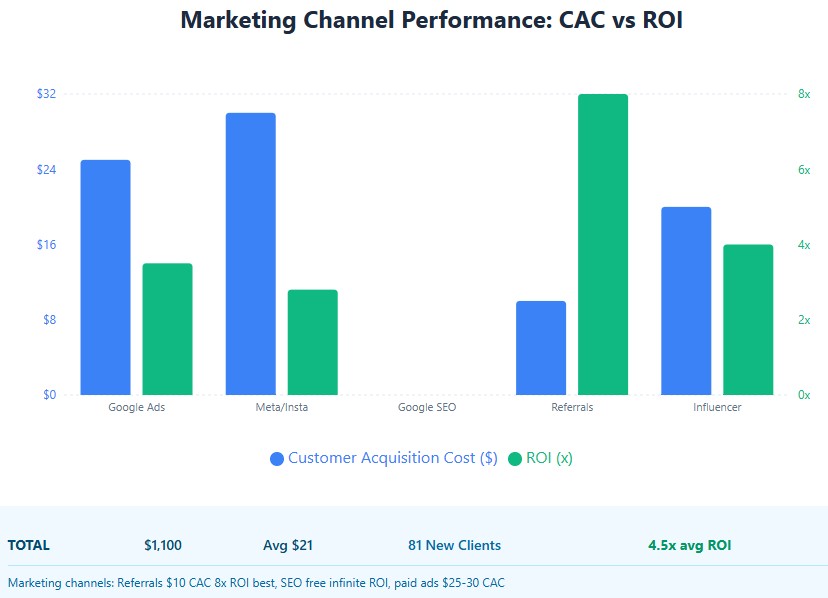
Ongoing Marketing Channels
| Channel | Monthly Budget | Expected CAC | Monthly Clients | ROI |
|---|---|---|---|---|
| Google Ads (Search) | $400 | $25 | 16 | 3.5x |
| Meta/Instagram Ads | $350 | $30 | 12 | 2.8x |
| Google Business Profile (SEO) | $0 | $0 | 25 | ∞ |
| Referral Program | $200 | $10 | 20 | 8.0x |
| Influencer Partnerships | $150 | $20 | 8 | 4.0x |
| TOTAL | $1,100 | Avg $21 | 81 | 4.5x avg |
Retention & Loyalty Program
Acquiring a new client costs 5x more than retaining an existing one (Bain & Company data). Our retention strategy focuses on frictionless rebooking:
- Automated SMS: “Hi [Name], it’s been 3 weeks since your gel manicure. Tap here to rebook with [Tech Name] for next week.” (Reduces no-shows from 31% to under 10%).
- Pre-Booking Incentive: Front desk staff trained to say, “Let’s get your next appointment on the books now so you get priority scheduling,” rather than “Do you want to rebook?”
- Loyalty Tiers:
- Insider (after 5 visits): Free nail art upgrade, priority weekend booking
- Elite (after 15 visits): 10% off all services, complimentary hand massage, birthday freebie
- Founder’s Circle (invitation only, top 5% spenders): 20% off, exclusive previews of new services, personal technician assignment
10. Risk Assessment & Mitigation
| Risk | Likelihood | Impact | Mitigation Strategy | Owner |
|---|---|---|---|---|
| Key technician leaves with clients | Medium (30%) | High | Non-solicit agreements, CRM owns all client data and phone numbers, cross-training, competitive compensation | Owner/Manager |
| Build-out or permitting delays | High (50%) | Medium | 10% contingency fund ($9,000), hire experienced local contractor, phased interior finish, temporary pop-up option | Owner/Manager |
| TDLR health/sanitation violation | Low (15%) | High | Digital, timestamped autoclave logs. Mandatory monthly staff sanitation refreshers. Quarterly self-inspections. | Senior Technician |
| Lower-than-expected foot traffic | Medium (35%) | Medium | $12K working capital reserve. Pivot marketing spend to targeted Meta/Google ads to drive destination visits. | Owner/Manager |
| Competitor opens nearby | Medium (40%) | Medium | Differentiate on speed/service guarantee, loyalty program, exclusive product line. Build strong brand loyalty. | Owner/Manager |
| Supply chain disruption (polish shortage) | Low (20%) | Low | Multiple suppliers (3+ vendors), 6-week inventory buffer for core colors, substitute products identified. | Manager |
| Regulatory changes (TDLR rules) | Low (10%) | Low | Join Texas Cosmetology Association for updates. Annual compliance review. Maintain relationships with inspectors. | Owner/Manager |
11. Management Team
| Role | Name | Experience | Responsibilities |
|---|---|---|---|
| Owner/Managing Partner | [Your Name] | 7 years salon management, 3 years as nail technician. Managed 12-person team at [Previous Salon]. Grew revenue 40% in 2 years. | Operations, P&L oversight, marketing, staff training, vendor negotiations. Also provides services 20 hrs/week. |
| Senior Nail Technician | [To Be Hired] | 5+ years experience, TDLR licensed. Specializes in gel and dip powder. Book of 50+ loyal clients. | Service delivery, train junior techs, maintain 4.8+ star rating, achieve sales targets. |
| Advisory Team | CPA + Attorney | Local CPA with salon/retail experience. Restaurant/beauty attorney for lease negotiation. | Monthly financial reviews, tax strategy, lease review, employment law compliance. |
12. Next Steps: Finalizing Your Plan
- Get Real Local Quotes: Replace the Austin-based estimates with actual quotes from three local general contractors and equipment vendors in your specific city. Build-out costs vary wildly by market.
- Verify State Regulations: Contact your state’s cosmetology board to confirm exact licensing fees, ventilation requirements, and autoclave mandates. Texas (TDLR) rules differ from California, New York, etc.
- Build the Dynamic Spreadsheet: Transfer the financial tables above into Excel or Google Sheets. Link the cells so that changing the “Average Ticket” from $60 to $65 automatically updates the entire Year 1 P&L and break-even analysis.
- Pre-Screen with a Lender: Before signing a lease, take this draft to a local bank or SBA Preferred Lender. Ask: “Based on this concept, what holes do you see in my financials?” Their feedback is free and invaluable.
- Validate Your Market: Spend 3 days at your target location counting foot traffic at different times. Talk to 10 potential clients. Visit every competitor. Your best insights won’t come from reports—they’ll come from conversations.
A business plan is not a static document you print and put in a drawer. It is a living financial dashboard. The most successful salon owners review their actual product costs, labor percentages, and chair utilization every single week, comparing them to the projections in this plan, and adjust their scheduling or purchasing accordingly.