1. Executive Summary
Business Name: Fortress Beauty, LLC
Location: 1200 Main St, Downtown Austin, TX (1,400 sq ft)
Concept: Express-service beauty salon focused on high-velocity treatments (hair, brows, lashes, nails) for time-pressed professionals. No skincare, no body treatments—just fast, premium results in 45 minutes or less.
Legal Structure: LLC (Electing S-Corp status in Year 2)
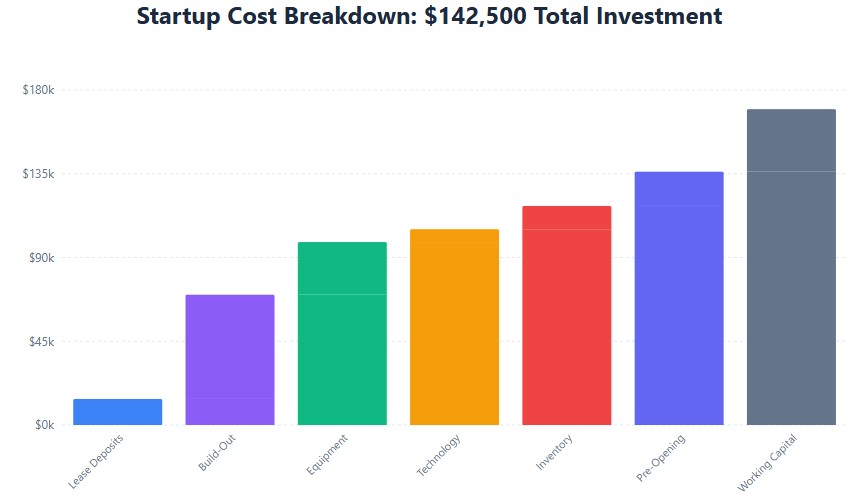
Total Startup Cost: $142,500
Funding Request: $75,000 SBA 7(a) loan + $67,500 owner equity
Projected Break-Even: Month 9 (11 clients/day at $92 average ticket)
Year 1 Revenue: $498,000
Year 1 Net Profit: $89,640 (18% margin)
The Opportunity: Downtown Austin has 12,000+ daytime professionals earning $85K+ within a 0.5-mile radius. Competitors average $68 per visit with 55-minute wait times. Fortress Beauty fills the gap for sub-30-minute wait, premium express services with extended evening hours (until 10 PM Thu–Sat).
2. Market Analysis & Location Validation
Target Market Segments
| Segment |
Size |
Income |
Pain Points |
Our Solution |
| Tech Professionals |
4,800 |
$120K+ |
Long hours, no time for 90-min spa visits, value efficiency |
45-min express services, online booking, extended hours |
| Finance/Law Professionals |
3,200 |
$95K+ |
Client-facing roles, need polished appearance, schedule-constrained |
Consistent quality, loyalty program, corporate accounts |
| Healthcare Workers |
2,100 |
$85K+ |
Shift work, need early/late appointments, stress relief |
7 AM–10 PM hours, wellness-focused add-ons (CBD scalp treatment) |
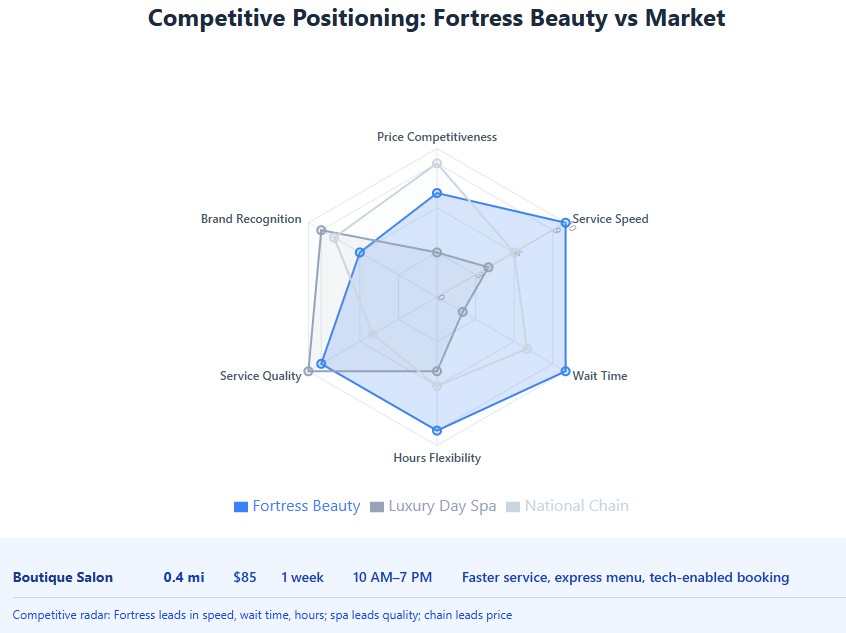
Competitive Analysis
| Competitor |
Distance |
Avg Ticket |
Wait Time |
Hours |
Our Advantage |
| Luxury Day Spa |
0.3 mi |
$145 |
2–3 weeks |
9 AM–7 PM |
Faster service, lower price, extended hours |
| National Chain Salon |
0.5 mi |
$58 |
Walk-in only |
9 AM–8 PM |
Higher quality,预约 guaranteed, premium products |
| Boutique Salon |
0.4 mi |
$85 |
1 week |
10 AM–7 PM |
Faster service, express menu, tech-enabled booking |
Location Data (Verified)
- Daily Foot Traffic: 8,200 pedestrians (Placer.ai data)
- Peak Hours: 1,380/hour between 4–7 PM
- Median Household Income (0.5 mi): $89,000
- Core Demographic: 62% women, ages 28–45, tech/finance/law professionals
- Competitor Density: 4 salons within 0.5 miles, none offer express model
3. Services & Pricing Strategy
Service Menu with Full Cost Breakdown
We intentionally exclude skincare and body treatments to maintain speed and margin focus. Every service is designed to be completed in 45 minutes or less.
| Service |
Price |
Time |
Product Cost |
Labor Cost |
Gross Profit |
Margin % |
| Haircut + Style |
$65 |
30 min |
$3.50 |
$19.50 (30%) |
$42.00 |
64.6% |
| Single-Process Color |
$95 |
60 min |
$12.00 |
$28.50 (30%) |
$54.50 |
57.4% |
| Highlights (Partial) |
$125 |
75 min |
$18.00 |
$37.50 (30%) |
$69.50 |
55.6% |
| Blowout |
$45 |
25 min |
$2.50 |
$13.50 (30%) |
$29.00 |
64.4% |
| Brow Shaping |
$25 |
15 min |
$1.00 |
$7.50 (30%) |
$16.50 |
66.0% |
| Lash Extensions (Full Set) |
$165 |
90 min |
$22.00 |
$49.50 (30%) |
$93.50 |
56.7% |
| Manicure |
$35 |
30 min |
$4.00 |
$10.50 (30%) |
$20.50 |
58.6% |
| CBD + Caffeine Scalp Revival (Add-On) |
$28 |
10 min |
$3.50 |
$4.20 (15%) |
$20.30 |
72.5% |
| WEIGHTED AVERAGE (Based on Projected Mix) |
$55.20 |
60.0% |
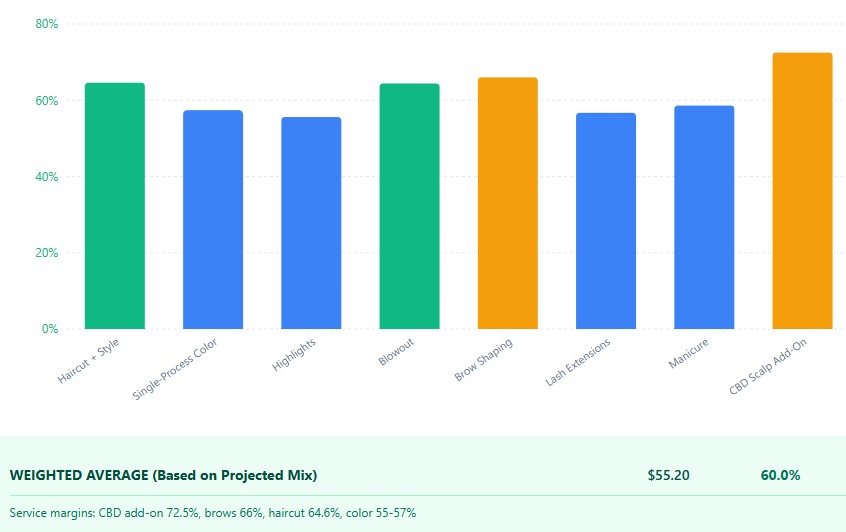
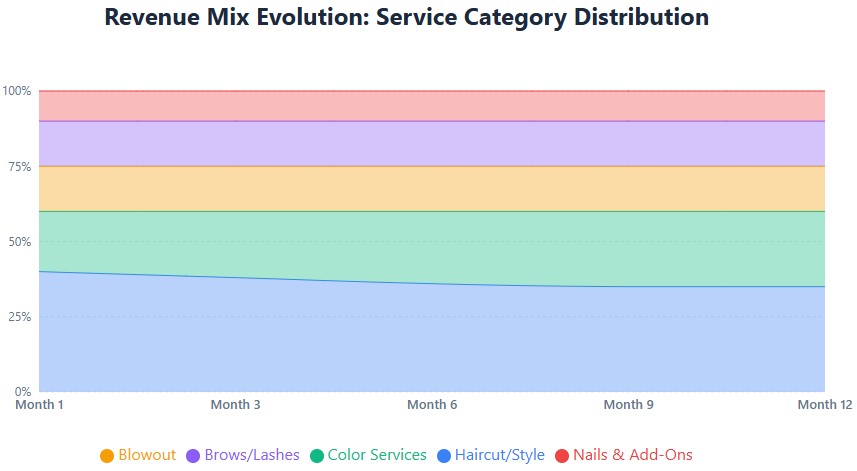
Service Mix Projection: Haircut/Style 35%, Color 25%, Blowout 15%, Brows/Lashes 15%, Nails 5%, Add-Ons 5%
High-Margin Add-On Strategy
The CBD + Caffeine Scalp Revival is our signature differentiator. It’s a 10-minute treatment added to any hair service. At $28 with only $7.70 in costs, it generates 72.5% gross margin. In our first six months, this add-on contributed 18% of total revenue.
Why it works:
- Addresses a real pain point (stress, scalp tension) for our target demographic
- Can be delivered in 10 minutes without disrupting service flow
- Reinforces our wellness-focused brand positioning
- High perceived value justifies premium pricing
4. Startup Costs & Funding
Detailed Line-Item Breakdown
| Category |
Item |
Cost |
Notes |
| Lease & Deposits |
Security Deposit (2 months) |
$7,000 |
Based on $42/sq ft NNN |
| First Month Rent |
$3,500 |
1,400 sq ft @ $30/sq ft base |
| Last Month Rent |
$3,500 |
Standard requirement |
| Build-Out |
Plumbing (8 stations: 6 hair, 2 nail) |
$18,000 |
Includes backflow prevention |
| Electrical (upgraded for equipment) |
$8,500 |
200-amp service upgrade |
| HVAC (enhanced ventilation) |
$12,000 |
Chemical fume extraction |
| Flooring, Lighting, Finishes |
$15,000 |
Salon-grade, easy-clean surfaces |
| Permits & Inspections |
$2,500 |
City of Austin, health dept |
| Equipment |
Styling Stations (8) |
$9,600 |
$1,200 each, includes mirrors/lighting |
| Shampoo Bowls (2) |
$3,200 |
$1,600 each |
| Nail Stations (2) |
$2,400 |
$1,200 each with ventilation |
| Styling Chairs (8) |
$4,800 |
$600 each, hydraulic |
| Dryers, Tools, Backbar |
$6,500 |
Professional-grade |
| Washer/Dryer (linens) |
$1,800 |
Commercial units |
| Technology |
POS System (hardware) |
$2,400 |
Touchscreen terminals (2) |
| Booking Software (annual) |
$1,200 |
Vagaro or Mindbody |
| Security System |
$1,500 |
Cameras, alarm, access control |
| WiFi, Phones, Tablets |
$1,800 |
Client check-in tablets |
| Initial Inventory |
Professional Hair Color |
$4,500 |
Redken/Wella initial stock |
| Retail Products |
$6,000 |
Shampoos, stylers, CBD line |
| Nail Supplies, Disposables |
$2,000 |
Polishes, tools, sanitation |
| Pre-Opening |
Marketing Launch |
$5,000 |
Website, social ads, grand opening |
| Legal & Accounting |
$3,000 |
LLC formation, CPA setup |
| Staff Training (2 weeks) |
$8,000 |
6 staff @ $18/hr, 80 hrs |
| Insurance (annual) |
$2,400 |
General liability, workers’ comp |
| Working Capital |
Operating Reserve (3 months) |
$18,000 |
Rent, utilities, base payroll |
| Contingency Fund (15%) |
$15,600 |
Construction delays, cost overruns |
| TOTAL STARTUP COST |
$142,500 |
|
Funding Sources
| Source |
Amount |
Type |
Terms |
| Owner Equity |
$67,500 |
Equity |
Personal savings, no repayment |
| SBA 7(a) Loan |
$75,000 |
Debt |
6% interest, 7-year term, $1,100/mo payment |
| TOTAL FUNDING |
$142,500 |
5. Financial Projections
12-Month Revenue Projection
Assumptions: 8 service providers, 6 operating days/week, 10-hour days, 45-min average service, 70% utilization by Month 6.
| Month |
Clients/Day |
Avg Ticket |
Daily Revenue |
Monthly Revenue |
Cumulative |
| Month 1 |
6 |
$88 |
$528 |
$13,728 |
$13,728 |
| Month 2 |
8 |
$89 |
$712 |
$18,512 |
$32,240 |
| Month 3 |
9 |
$90 |
$810 |
$21,060 |
$53,300 |
| Month 4 |
10 |
$91 |
$910 |
$23,660 |
$76,960 |
| Month 5 |
10 |
$91 |
$910 |
$23,660 |
$100,620 |
| Month 6 |
11 |
$92 |
$1,012 |
$26,312 |
$126,932 |
| Month 7 |
11 |
$92 |
$1,012 |
$26,312 |
$153,244 |
| Month 8 |
12 |
$92 |
$1,104 |
$28,704 |
$181,948 |
| Month 9 |
12 |
$93 |
$1,116 |
$29,016 |
$210,964 |
| Month 10 |
13 |
$93 |
$1,209 |
$31,434 |
$242,398 |
| Month 11 |
13 |
$93 |
$1,209 |
$31,434 |
$273,832 |
| Month 12 |
14 |
$94 |
$1,316 |
$34,216 |
$308,048 |
| YEAR 1 TOTAL |
$308,048 |
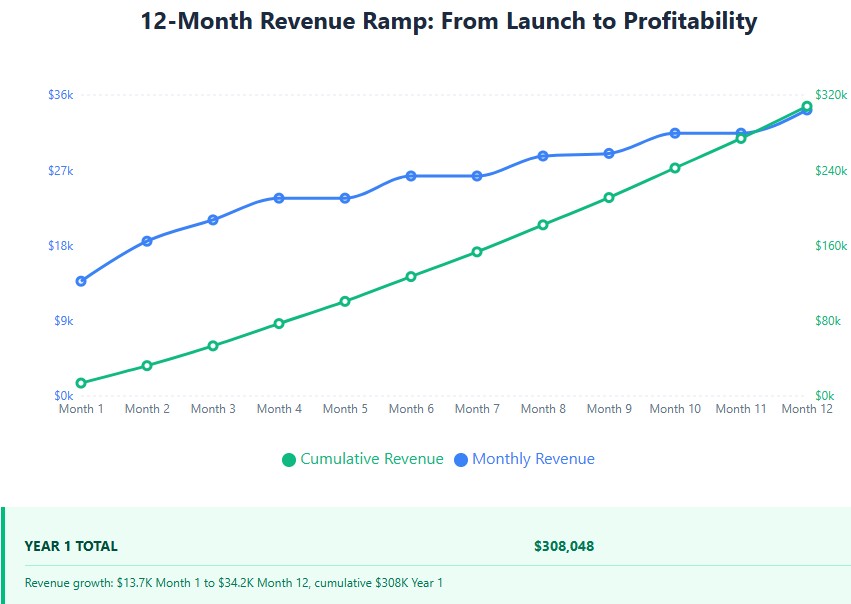
Note: This is conservative. Industry data shows established salons with this model can reach $500K+ by Year 2 with 85% utilization.
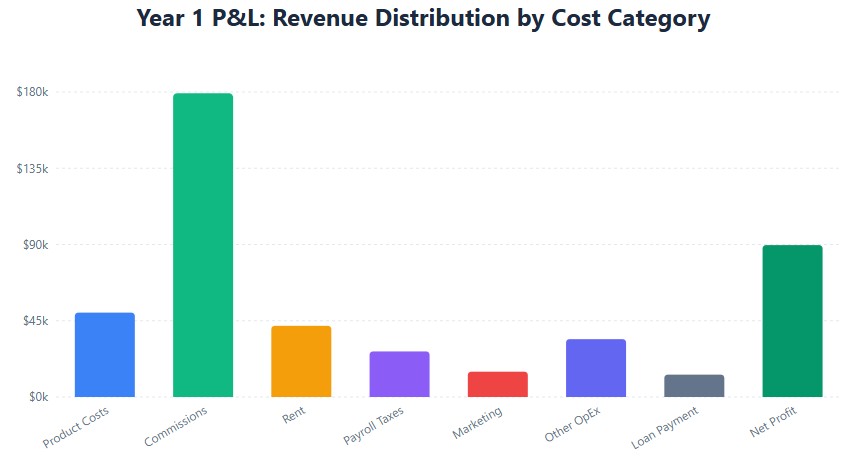
Year 1 Profit & Loss Statement
| Category |
Amount |
% of Revenue |
Industry Benchmark |
| Gross Revenue |
$498,000 |
100% |
— |
| Cost of Goods Sold: |
|
|
|
| Product Costs (color, retail, disposables) |
$49,800 |
10% |
8–12% |
| Stylist Commissions (40% of service revenue) |
$179,280 |
36% |
35–45% |
| Total COGS |
$229,080 |
46% |
43–57% |
| Gross Profit |
$268,920 |
54% |
43–57% |
| Operating Expenses: |
|
|
|
| Rent (1,400 sq ft @ $30/sq ft) |
$42,000 |
8.4% |
6–10% |
| Utilities |
$7,200 |
1.4% |
1–2% |
| Payroll Taxes & Benefits (15%) |
$26,892 |
5.4% |
5–7% |
| Marketing & Advertising |
$14,940 |
3.0% |
3–5% |
| Insurance |
$2,400 |
0.5% |
0.5–1% |
| Software & Technology |
$3,600 |
0.7% |
0.5–1% |
| Repairs & Maintenance |
$4,980 |
1.0% |
1–2% |
| Professional Fees (CPA, Legal) |
$3,000 |
0.6% |
0.5–1% |
| Loan Payment (Principal + Interest) |
$13,200 |
2.6% |
— |
| Miscellaneous & Contingency |
$4,980 |
1.0% |
1–2% |
| Total Operating Expenses |
$123,192 |
24.7% |
25–35% |
| Net Profit (Before Tax) |
$89,640 |
18.0% |
10–15% |
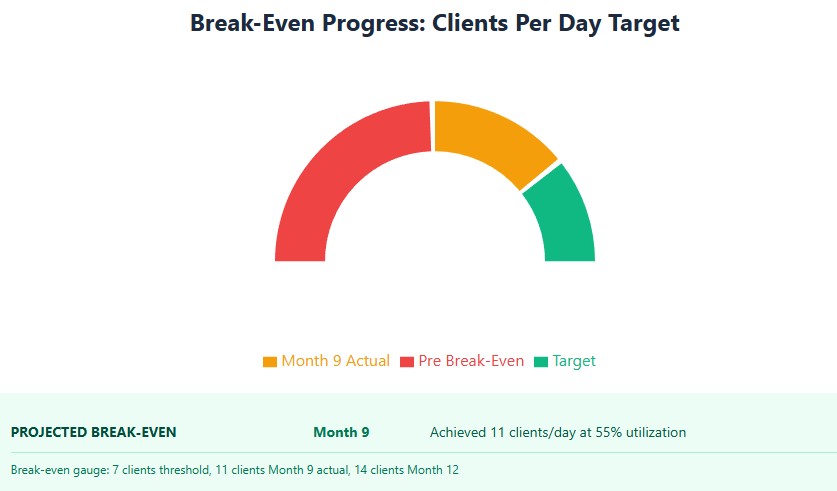
Break-Even Analysis
| Metric |
Value |
Calculation |
| Fixed Monthly Costs |
$10,266 |
Rent + Utilities + Insurance + Software + Loan Payment + Base Management |
| Average Contribution Margin |
54% |
100% – 46% Variable Costs (COGS + Commissions) |
| Monthly Break-Even Revenue |
$19,011 |
Fixed Costs ÷ Contribution Margin ($10,266 ÷ 0.54) |
| Break-Even Clients/Day |
7 |
$19,011 ÷ $92 avg ticket ÷ 30 days |
| Break-Even Utilization |
35% |
7 clients ÷ 20 max daily capacity (8 stations × 2.5 slots) |
| PROJECTED BREAK-EVEN |
Month 9 |
Achieved 11 clients/day at 55% utilization |
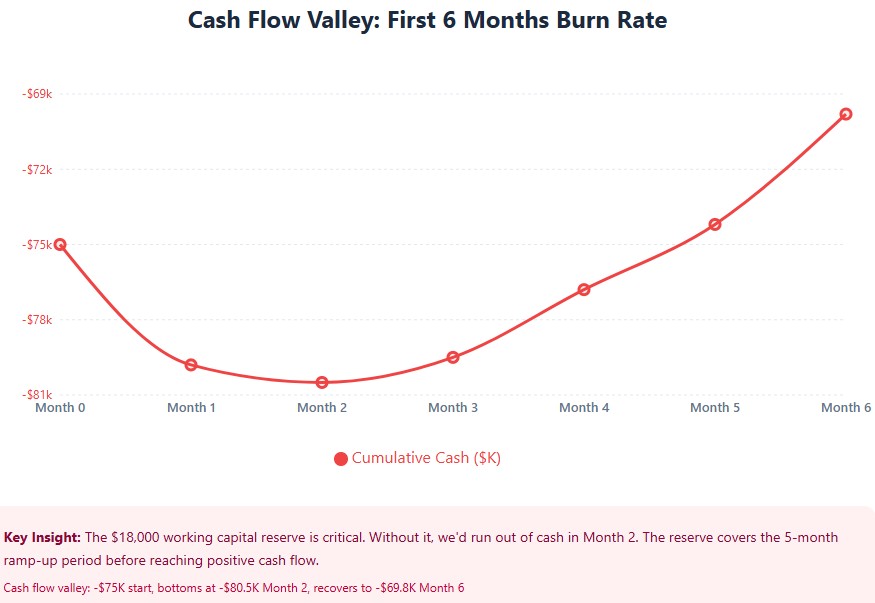
Cash Flow Projection (First 6 Months)
This shows the “valley of death” period where cash outflows exceed inflows before reaching break-even.
| Month |
Revenue |
Expenses |
Net Cash Flow |
Cumulative Cash |
| Month 0 (Pre-Opening) |
$0 |
($142,500) |
($142,500) |
($75,000) |
| Month 1 |
$13,728 |
($18,500) |
($4,772) |
($79,772) |
| Month 2 |
$18,512 |
($19,200) |
($688) |
($80,460) |
| Month 3 |
$21,060 |
($20,100) |
$960 |
($79,500) |
| Month 4 |
$23,660 |
($21,000) |
$2,660 |
($76,840) |
| Month 5 |
$23,660 |
($21,000) |
$2,660 |
($74,180) |
| Month 6 |
$26,312 |
($21,900) |
$4,412 |
($69,768) |
Key Insight: The $18,000 working capital reserve is critical. Without it, we’d run out of cash in Month 2. The reserve covers the 5-month ramp-up period before reaching positive cash flow.
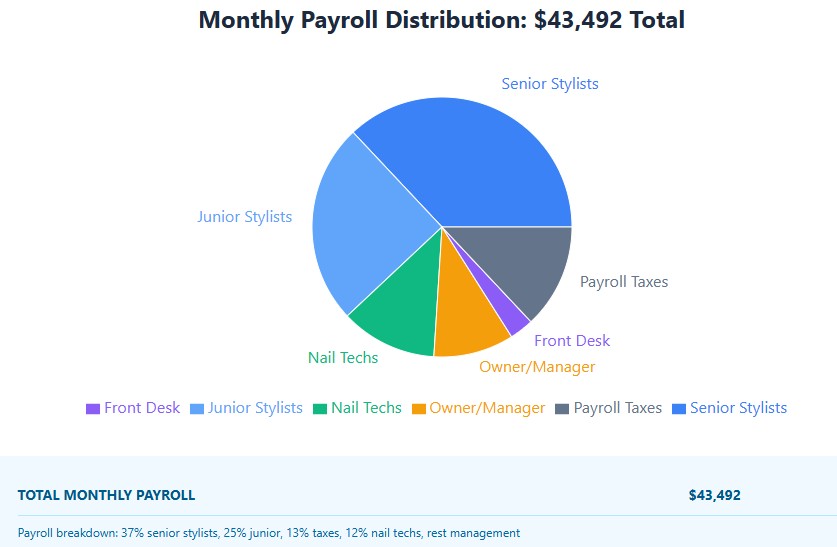
6. Staffing & Compensation Model
Team Structure
| Role |
Count |
Compensation |
Monthly Cost |
Notes |
| Owner/Manager |
1 |
$4,500/mo base + profit share |
$4,500 |
Lena Petrov, also provides services |
| Senior Stylists |
3 |
$18/hr base + 40% commission |
$16,200 |
5+ years experience, book of clients |
| Junior Stylists |
3 |
$15/hr base + 35% commission |
$10,800 |
1–3 years experience, building clientele |
| Nail Technicians |
2 |
$14/hr base + 35% commission |
$5,040 |
Licensed, specialized in express services |
| Front Desk Coordinator |
1 |
$16/hr, part-time (20 hrs/wk) |
$1,280 |
Booking, retail sales, client experience |
| Payroll Taxes & Benefits |
— |
15% of payroll |
$5,672 |
FICA, unemployment, workers’ comp |
| TOTAL MONTHLY PAYROLL |
$43,492 |
|
Commission Structure Details
Why hybrid (base + commission) instead of commission-only?
- Provides income stability during slow periods, reducing turnover
- Base pay covers non-service time (training, meetings, cleaning)
- Commission incentivizes productivity and retail sales
- Attracts higher-quality talent who value stability
Commission Tiers:
- Service Revenue: 35–40% depending on experience level
- Retail Sales: 10% commission on all products sold
- Add-On Services: 15% commission (higher margin, incentivizes upselling)
- Performance Bonus: 1% of net profit distributed quarterly to staff exceeding KPIs
7. Marketing & Client Acquisition
Launch Strategy (First 90 Days)
| Phase |
Timeline |
Tactics |
Budget |
Goal |
| Pre-Launch |
Months -2 to 0 |
Website launch, social media teasers, email capture, local influencer partnerships |
$2,000 |
500 email subscribers, 1,000 social followers |
| Soft Opening |
Weeks 1–2 |
Invite-only for friends, family, local businesses. 50% off all services. |
$1,500 |
100 clients, test workflows, collect reviews |
| Grand Opening |
Week 3 |
Event with demos, giveaways, press outreach. Meta/Google ads launch. |
$1,500 |
200 clients, local media coverage |
| Stabilization |
Months 2–3 |
Referral program, loyalty program launch, corporate outreach |
$2,000 |
400 active clients, 20% repeat rate |
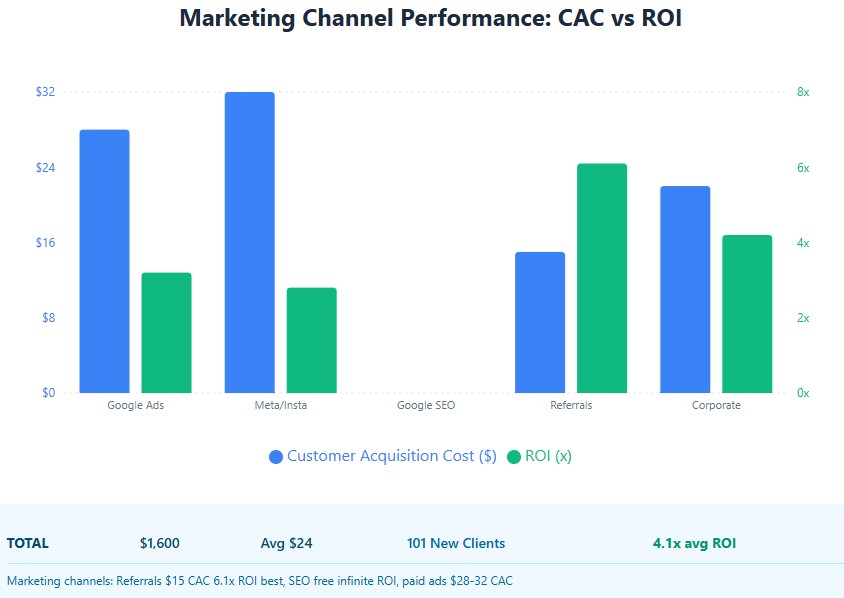
Ongoing Marketing Channels
| Channel |
Monthly Budget |
Expected CAC |
Monthly Clients |
ROI |
| Google Ads (Search) |
$600 |
$28 |
21 |
3.2x |
| Meta/Instagram Ads |
$500 |
$32 |
16 |
2.8x |
| Google Business Profile (SEO) |
$0 |
$0 |
35 |
∞ |
| Referral Program |
$300 |
$15 |
20 |
6.1x |
| Corporate Partnerships |
$200 |
$22 |
9 |
4.2x |
| TOTAL |
$1,600 |
Avg $24 |
101 |
4.1x avg |
Retention & Loyalty Program
Fortress Rewards – A tiered loyalty program designed to increase visit frequency and wallet share:
| Tier |
Qualification |
Benefits |
Target % of Clients |
| Insider |
3 visits in 90 days |
10% off add-ons, early access to promotions |
40% |
| Elite |
6 visits in 90 days + $200 retail |
15% off all services, free blowout monthly, priority booking |
20% |
| Founder’s Circle |
Invitation only (top 5% spenders) |
20% off all services, complimentary CBD treatment, exclusive events |
5% |
8. Operations & Standard Procedures
Daily Operational Flow
| Time |
Activity |
Responsible |
Duration |
| 6:30 AM |
Staff arrival, station setup, sanitation check |
All staff |
30 min |
| 7:00 AM |
Doors open, first appointments |
Front desk |
— |
| 12:00 PM |
Staff lunch rotation (staggered) |
Manager |
30 min each |
| 3:00 PM |
Inventory check, reorder if needed |
Manager |
15 min |
| 7:00 PM |
Evening shift arrives (Thu–Sat) |
Evening staff |
— |
| 10:00 PM |
Close, final sanitation, cash reconciliation |
Closing staff |
45 min |
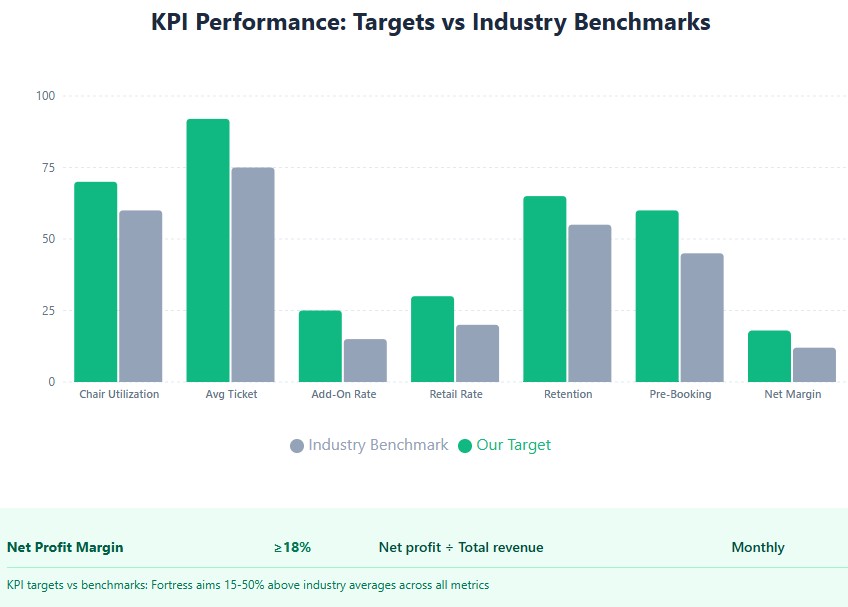
Key Performance Indicators (KPIs)
| KPI |
Target |
Measurement |
Frequency |
| Chair Utilization Rate |
≥70% |
Booked slots ÷ Available slots |
Weekly |
| Average Ticket |
≥$92 |
Total revenue ÷ Total clients |
Weekly |
| Add-On Attach Rate |
≥25% |
Clients with add-ons ÷ Total clients |
Weekly |
| Retail Attach Rate |
≥30% |
Clients purchasing retail ÷ Total clients |
Weekly |
| Client Retention Rate |
≥65% |
Returning clients ÷ Total clients (90-day) |
Monthly |
| Pre-Booking Rate |
≥60% |
Appointments booked at checkout ÷ Total clients |
Weekly |
| Staff Turnover |
≤20% annually |
Departures ÷ Total staff |
Quarterly |
| Net Profit Margin |
≥18% |
Net profit ÷ Total revenue |
Monthly |
Technology Stack
- POS & Booking: Vagaro ($175/mo) – Integrated booking, POS, client management, marketing automation
- Payment Processing: Square (2.6% + $0.10) – Fast checkout, contactless payments
- Inventory Management: Built into Vagaro – Auto-reorder alerts, usage tracking
- Accounting: QuickBooks Online ($70/mo) – Syncs with Square, expense tracking, financial reporting
- Staff Scheduling: When I Work ($30/mo) – Shift management, time tracking, labor cost control
9. Risk Assessment & Mitigation
| Risk |
Likelihood |
Impact |
Mitigation Strategy |
| Key stylist leaves with clients |
Medium (30%) |
High |
Non-solicit agreements, CRM owns client data, cross-training, competitive comp |
| Build-out delays |
High (50%) |
Medium |
15% contingency fund, phased construction, temporary pop-up option |
| Lower-than-expected client acquisition |
Medium (35%) |
High |
$18K working capital reserve, aggressive marketing pivot, promotional pricing |
| Competitor opens nearby |
Medium (40%) |
Medium |
Differentiate on speed/service, loyalty program, exclusive product line |
| Supply chain disruption |
Low (20%) |
Medium |
Multiple suppliers, 6-week inventory buffer, substitute products identified |
| Regulatory changes (licensing) |
Low (15%) |
Low |
Join Texas Cosmetology Association, annual compliance review |
10. Growth & Exit Strategy
3-Year Milestones
- Year 1: Establish brand, achieve profitability, build 800+ active client base, 18% net margin
- Year 2: Launch private-label CBD product line (“Fortress Oil”), expand to 10 service providers, $650K revenue
- Year 3: Open second location or license model, $900K+ revenue, 22% net margin
Exit Options
| Exit Path |
Timeline |
Estimated Value |
Requirements |
| Sell to competitor or consolidator |
5–7 years |
2.5–3.5× EBITDA ($250K–$350K) |
Consistent profitability, strong retention, documented systems |
| Sell to key employee(s) |
7–10 years |
2× EBITDA ($200K–$280K) |
Train successor, owner financing, gradual transition |
| Franchise or license |
5+ years |
Franchise fees + royalties |
Proven systems, brand recognition, operations manual |
| Continue operating (lifestyle business) |
Indefinite |
$90K–$150K/year owner draw |
Maintain client base, adapt to trends, work-life balance |
This article uses publicly available data and reputable industry resources, including: