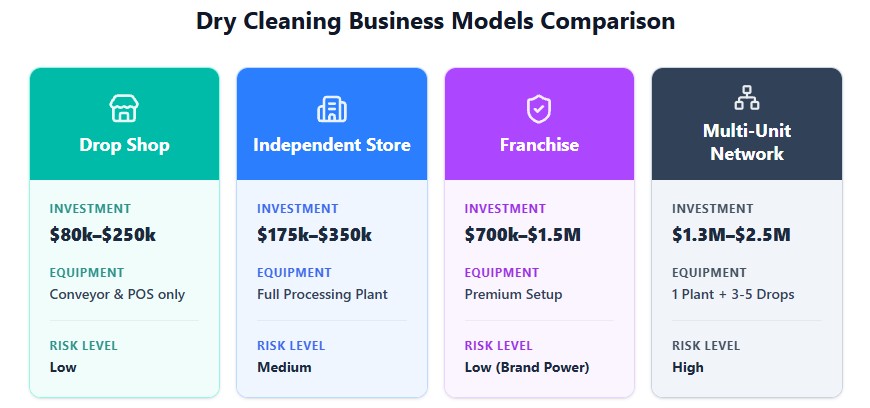
Starting a dry cleaning business costs $175,000 to $350,000 for an independent single-location shop with on-site equipment, or $700,000 to $2.5 million for a franchise-based hub-and-spoke network. Drop shops, which operate as pickup locations without cleaning equipment, cost $80,000 to $250,000. The average dry cleaning business generates $200,000 to $500,000 in annual revenue, with net profit margins generally ranging from 10% to 23%. Single-location independents typically net 10-14%, while multi-unit hub-and-spoke networks can reach 18-23%. Revenue per 50-lb machine may reach $120,000-$180,000 annually at 70-80% utilization, depending on item mix, pricing, operating hours, and local demand.
How Much to Start a Dry Cleaning Business: Complete Cost Breakdown
Dry cleaning is capital-intensive. Startup costs depend on whether you build a full plant, operate a drop shop, outsource processing, choose wet-cleaning equipment, or invest in a franchise network. The figures below are planning ranges rather than guaranteed prices; local construction, permitting, equipment specifications, utility capacity, and financing terms can materially change the final budget.
Startup Costs by Business Model
| Business Model | Total Startup Cost | Equipment Cost | Buildout & Renovation | Working Capital | Time to Open |
|---|---|---|---|---|---|
| Independent Single-Location Plant | $175,000-$350,000 | $85,000-$150,000 | $40,000-$85,000 | $30,000-$65,000 | 90-120 days |
| Drop Shop, Pickup Only | $80,000-$250,000 | $0-$15,000 | $25,000-$60,000 | $20,000-$50,000 | 45-75 days |
| Franchise Plant Store | $700,000-$1.5 million | $350,000-$600,000 | $200,000-$400,000 | $100,000-$200,000 | 120-180 days |
| Franchise Central Plant and Drop Shops | $1.3 million-$2.5 million | $600,000-$1.2 million | $400,000-$800,000 | $200,000-$400,000 | 180-240 days |
| Wet-Cleaning Plant | $140,000-$290,000 | $45,000-$90,000 | $35,000-$75,000 | $25,000-$55,000 | 75-100 days |
| Pickup and Delivery With Outsourced Processing | $50,000-$150,000 | $0 | $10,000-$25,000 | $25,000-$75,000 | 30-60 days |
Market-size context: IBISWorld estimates U.S. dry-cleaner industry revenue at approximately $9.6 billion in 2026. For financing and loan-program information, consult the U.S. Small Business Administration. Employment and wage assumptions can be checked against the U.S. Bureau of Labor Statistics.
Buying an Existing Dry Cleaning Business
Buying an operating dry cleaner can provide an established customer base, trained employees, existing supplier relationships, and immediate revenue. The purchase price is usually analyzed through seller’s discretionary earnings, or SDE, rather than equipment value alone.
| Business Type | Indicative Valuation Multiple | Typical Price Range | What Supports a Higher Multiple |
|---|---|---|---|
| Single-Location Independent | 2.0x-2.5x SDE | $150,000-$400,000 | Stable repeat customers, clean financial records, modern equipment |
| Multi-Unit Hub-and-Spoke | 2.5x-3.0x SDE | $500,000-$1.5 million | Commercial contracts, delivery routes, centralized production |
| Drop Shop | 1.5x-2.0x SDE | $80,000-$200,000 | Prime location, strong customer retention, reliable processing hub |
| Franchise Resale | 2.0x-2.5x SDE | $400,000-$1.2 million | Transferable franchise agreement, brand demand, documented route revenue |
Example: If a shop produces $60,000 in SDE, a 2.0x-2.5x valuation implies an estimated operating-business price of $120,000-$150,000 before considering real estate, debt, working capital, or transaction costs. SDE is not the same as net income: it normally adds back the owner’s compensation, certain discretionary expenses, depreciation, interest, and other approved adjustments.
Environmental due diligence is mandatory. Never buy a dry cleaning business without commissioning a Phase I and, where indicated, Phase II Environmental Site Assessment. A Phase I reviews historical land use and identifies potential contamination; a Phase II uses soil, groundwater, or vapor testing to investigate recognized environmental conditions. Legacy PERC contamination can create substantial cleanup and legal exposure. Depending on the site, remediation can reach $100,000-$500,000 or more, so the purchase agreement should address indemnities, escrow, environmental insurance, access rights, and responsibility for pre-existing contamination. The U.S. EPA Brownfields program provides background on contaminated commercial properties, while environmental consultants commonly recommend formal Phase I/II diligence for former dry-cleaning sites.
Detailed Cost Breakdown: Independent Single-Location Shop
| Cost Category | Low End | High End | Notes |
|---|---|---|---|
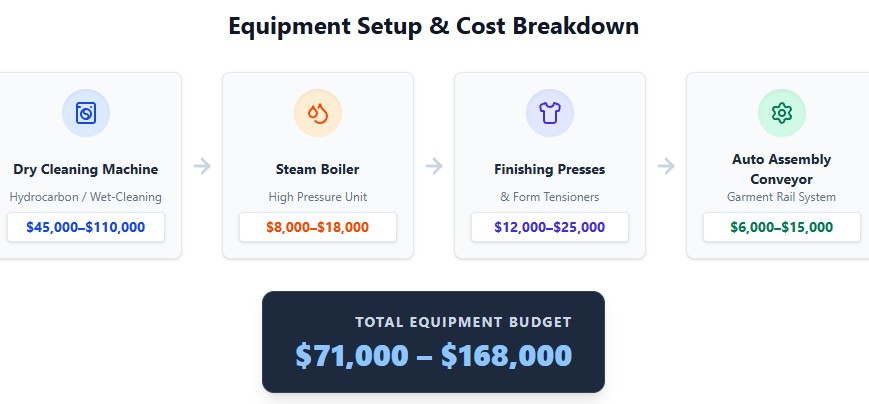
| Hydrocarbon Dry-Cleaning Machine | $85,000 | $150,000 | Machine package may include pumps, controls, installation components, and related finishing equipment |
| Wet-Cleaning Equipment | $45,000 | $90,000 | Alternative configuration; actual plant may require additional dryers, presses, and finishing systems |
| Buildout and Renovation | $40,000 | $85,000 | Electrical service, plumbing, ventilation, drainage, fire protection, customer area, signage, and optional drive-thru |
| Initial Supplies | $8,000 | $16,000 | Solvent or detergents, hangers, packaging, spotting agents, filters, tags, and consumables |
| Licenses and Permits | $3,000 | $13,000 | Business registration, local approvals, fire inspection, air permit where required, waste registration, and professional fees |
| Lease Deposit | $9,000 | $27,000 | Often based on two to three months of rent, plus possible prepaid charges |
| Working Capital | $30,000 | $65,000 | Payroll, utilities, rent, supplies, insurance, marketing, repairs, and debt service during ramp-up |
| Point-of-Sale and Customer System | $3,000 | $7,000 | POS hardware, garment tracking, customer notifications, payment integration, and reporting |
| Insurance | $4,000 | $9,000 | General liability, property, workers’ compensation, environmental coverage, and commercial auto where applicable |
| Opening Marketing | $2,000 | $6,000 | Signage, local search setup, direct mail, introductory offers, and launch campaigns |
| Delivery Vehicle | $0 | $35,000 | Optional used cargo van or initial vehicle contribution; excludes ongoing route costs |
| Total Planning Range | $175,000 | $350,000 | Excludes real-estate acquisition and major contamination remediation |
Loan proceeds should not be confused with startup cost. A financed machine still requires equity, closing costs, collateral, interest, and sufficient cash reserves. The SBA loan programs page explains the main federal financing categories, but approval terms depend on borrower credit, collateral, projected cash flow, and lender underwriting.
Drop Shop Cost Breakdown
A drop shop does not clean garments on site. It accepts orders, stores finished garments, and transfers production to a central plant. Its lower equipment requirement is offset by processing charges, transport costs, and dependence on the plant’s capacity and service quality.
| Cost Category | Low End | High End | Notes |
|---|---|---|---|
| Garment Conveyor or Storage System | $8,000 | $15,000 | Storage and retrieval system sized to expected garment volume |
| Point-of-Sale System | $3,000 | $6,000 | Order entry, garment tracking, payment processing, and notifications |
| Buildout and Renovation | $25,000 | $60,000 | Customer counter, storage area, signage, security, lighting, and climate control |
| Lease Deposit | $12,000 | $30,000 | Reflects smaller but often more expensive retail space |
| Working Capital | $20,000 | $50,000 | Counter staff, rent, marketing, transport to the plant, and initial operating losses |
| Initial Supplies | $2,000 | $5,000 | Tags, bags, hangers, packaging, and customer-service materials |
| Marketing | $2,000 | $5,000 | Local launch and customer acquisition |
| Insurance and Licenses | $3,000 | $6,000 | Business, premises, employee, and customer-property coverage |
| Total Planning Range | $80,000 | $250,000 | Assumes no on-site cleaning machinery |
Equipment Cost by Capacity and Type
| Equipment Type | Capacity | New Price | Refurbished Price | Typical Use |
|---|---|---|---|---|
| Hydrocarbon Machine | 35-50 lb | $85,000-$150,000 | $50,000-$85,000 | Independent plant with moderate local volume |
| Hydrocarbon Machine | 80-100 lb | $160,000-$260,000 | $95,000-$150,000 | Central plant serving multiple locations |
| Wet-Cleaning Machine | 40-80 lb | $45,000-$90,000 | $25,000-$50,000 | Water-based cleaning and lower-solvent operating model |
| Boiler or Steam Generator | 10-20 HP | $12,000-$26,000 | $6,000-$13,000 | Steam finishing and pressing |
| Air Compressor | 5-10 HP | $4,000-$9,000 | $2,000-$5,000 | Pneumatic presses and finishing equipment |
| Finishing Tables and Presses | — | $8,000-$16,000 | $4,000-$9,000 | Pressing, shaping, and final presentation |
| POS and Garment Tracking | — | $3,000-$7,000 | $1,500-$3,500 | Orders, barcodes, customer history, and notifications |
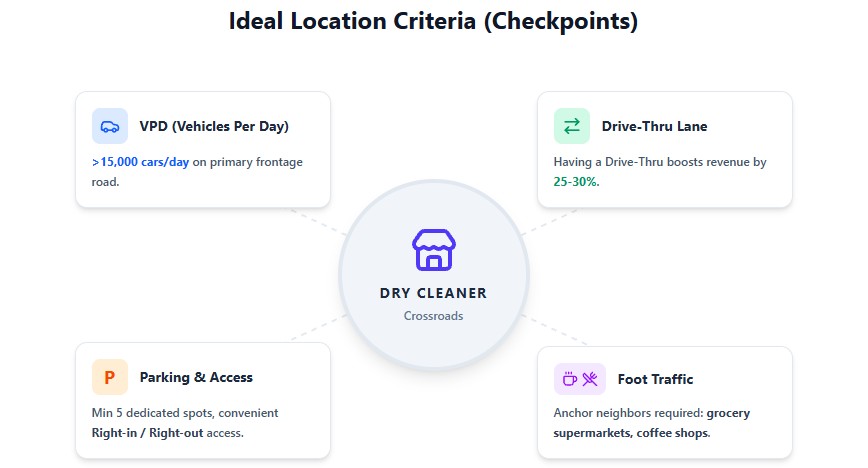
Location Criteria: Foot Traffic, Drive-Thru, and VPD
Retail dry cleaning is a convenience business. A highly visible site with easy vehicle access can outperform a cheaper location that customers find inconvenient. VPD, or vehicles per day, is useful for comparing sites, but it is not a universal revenue formula. Measure access, turning movements, parking, visibility, nearby anchors, local income, competitors, and the share of traffic that can actually stop.
| Location Factor | Practical Target | Why It Matters | How to Validate It |
|---|---|---|---|
| Vehicles Per Day | 15,000+ as an initial screening target | Improves visibility and drive-by awareness | Request municipal, DOT, landlord, or traffic-count data |
| Drive-Thru or Curb Access | Strong advantage for retail-heavy stores | Reduces friction for drop-off and pickup | Confirm zoning, curb cuts, stacking, and landlord approval |
| Parking | Dedicated, convenient spaces near the entrance | Dry cleaning customers often make quick stops | Visit during peak periods and count availability |
| Anchor Tenants | Grocery, pharmacy, fitness, or daily-needs retailers | Creates recurring trips and cross-shopping | Review tenant mix and lease stability |
| Household Income | Use local market data rather than a universal cutoff | Higher-income households often buy more convenience services | Compare Census ACS income, employment, and household data |
| Competitive Density | Map competitors by drive time, not just radius | Protects pricing and customer acquisition potential | Check Google Maps, local directories, and field conditions |
Use the U.S. Census Bureau data portal for local demographics and the BLS Occupational Employment and Wage Statistics for wage planning. A VPD threshold should be treated as a site-screening assumption, not a guaranteed percentage increase in revenue.
How Much Do Dry Cleaners Make?
Revenue and owner earnings depend on capacity, price per garment, customer mix, route density, equipment utilization, labor structure, and whether the owner works in production. A shop’s reported “profit” can also mean different things: accounting net income, seller’s discretionary earnings, cash flow before debt service, or the owner’s total economic benefit.
Revenue and Profit by Business Model
| Business Model | Annual Revenue Range | Typical Net Margin Range | Indicative Annual Profit | Main Economic Driver |
|---|---|---|---|---|
| Single-Location Independent | $200,000-$450,000 | 10-14% | $20,000-$63,000 | Owner involvement, local demand, plant utilization, and route mix |
| Multi-Unit Hub-and-Spoke | $600,000-$1.4 million | 18-23% | $108,000-$322,000 | Centralized production, purchasing power, and better equipment utilization |
| Franchise Network | $450,000-$1.6 million | 12-18% | $54,000-$288,000 | Brand demand, route density, royalties, and operating standards |
| Commercial Route Specialist | $350,000-$900,000 | 15-20% | $53,000-$180,000 | Recurring B2B volume and production scheduling |
| Wet-Cleaning Plant | $150,000-$400,000 | 14-19% | $21,000-$76,000 | Lower solvent exposure, service positioning, and equipment utilization |
| Pickup and Delivery With Outsourced Processing | $100,000-$300,000 | 8-14% | $8,000-$42,000 | Customer acquisition, route density, and processor pricing |
These are planning ranges, not official industry-wide medians. Public industry sources such as IBISWorld’s U.S. dry-cleaner profile describe market revenue and business-count trends, but they do not provide a single audited net-margin figure for every independent dry cleaner. That is why a buyer should rely on tax returns, bank statements, POS reports, payroll records, and normalized SDE rather than an online average.
Revenue per Machine: Correct Calculation
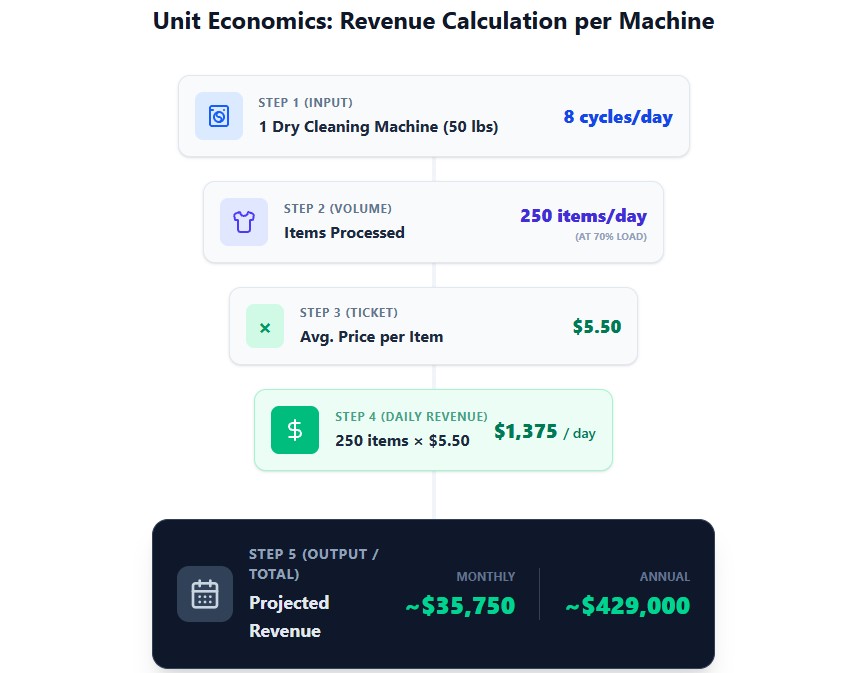
Dry cleaning is normally priced per garment, not per pound. A machine’s capacity is expressed in pounds, but revenue depends on how many garments fit in each load, the garment mix, the average selling price, re-clean rates, operating days, and actual utilization.
| Machine Capacity | Items per Load | Loads per Day | Items per Day | Average Price per Item | Illustrative Annual Gross Revenue |
|---|---|---|---|---|---|
| 35 lb | 18-24 | 7-8 | 126-192 | $4.50-$5.50 | $147,000-$275,000 |
| 50 lb | 25-35 | 7-8 | 175-280 | $4.50-$6.00 | $205,000-$437,000 |
| 80 lb | 40-55 | 6-7 | 240-385 | $4.00-$5.50 | $250,000-$551,000 |
| 100 lb | 50-70 | 6-7 | 300-490 | $4.00-$5.50 | $312,000-$701,000 |
The table shows a theoretical production envelope, not a guaranteed store revenue. A realistic forecast should reduce theoretical capacity for incomplete loads, sorting, spotting, pressing, equipment downtime, seasonality, staffing, quality control, and demand. For example, 200 sellable items per day at a $5 average price over 260 operating days produces approximately $260,000 in annual garment revenue before alterations, household items, delivery fees, or commercial contracts.
Average ticket: A $24-$32 retail ticket may represent four to six garments, but ticket size varies substantially by local pricing, garment mix, household income, delivery minimums, and commercial work.
Unit Economics: Profit Margins by Garment Type
Garment-level margin analysis shows where the business actually earns money. Direct cost should include the incremental labor, cleaning chemistry, utilities, packaging, rework allowance, and other costs directly associated with processing the item. It should not be confused with full net margin after rent, management, insurance, marketing, debt service, and owner compensation.
| Garment or Service | Typical Selling Price | Indicative Direct-Cost Range | Illustrative Gross Margin | Commercial Role |
|---|---|---|---|---|
| Men’s Dress Shirt | $3.50-$5.50 | $2.00-$2.75 | 40-50% | Frequent volume and customer-retention driver |
| Women’s Blouse | $5.00-$8.00 | $2.50-$3.50 | 50-60% | Mid-margin service with regular demand |
| Two-Piece Suit | $12.00-$18.00 | $4.00-$6.00 | 60-70% | Higher-ticket core service |
| Women’s Dress | $15.00-$25.00 | $5.00-$7.50 | 65-75% | Event-driven and higher-value processing |
| Pants or Slacks | $6.00-$9.00 | $2.50-$3.50 | 55-65% | Steady workwear volume |
| Comforter | $35.00-$55.00 | $12.00-$18.00 | 65-70% | Household add-on and seasonal demand |
| Leather Jacket | $40.00-$75.00 | $10.00-$15.00 | 70-80% | Specialty service requiring expertise and risk controls |
| Wedding Dress | $150.00-$350.00 | $30.00-$60.00 | 75-85% | High-ticket specialty service with low frequency |
| Curtains, Rugs, and Household Items | $50.00-$150.00 | $15.00-$30.00 | 65-75% | Specialty, household, and selected B2B work |
These figures should be replaced with the operator’s own POS and job-costing data. Specialty services may show a high gross margin but still produce weak net profit if they require extensive inspection, handwork, storage, insurance, re-cleaning, or claims handling.
Franchise Comparison
Franchises can provide brand recognition, site-selection support, training, purchasing systems, and standardized processes. The economic question is whether those benefits generate enough incremental revenue or reduce enough operating risk to offset royalties and marketing fees.
| Model | Illustrative Initial Fee | Royalty Structure | Illustrative Total Investment | Best Fit |
|---|---|---|---|---|
| Tide Cleaners | About $50,000 | Reported 7% royalty plus marketing contribution; verify current FDD | $700,000-$2.5 million | Operators seeking a large branded hub-and-spoke system |
| Lapels | Verify current FDD | Reported approximately 6% royalty plus marketing contribution; verify current FDD | $500,000-$1.8 million | Regional operators evaluating a flexible branded model |
| Martinizing | Verify current FDD | Reported approximately 5-6% royalty plus marketing contribution; verify current FDD | $400,000-$1.5 million | Operators valuing established brand history and lower stated fees |
| Independent | $0 | 0% | $175,000-$350,000 | Owners with industry expertise and local marketing capability |
Do not rely on third-party franchise summaries when comparing brands. Request each franchisor’s current Franchise Disclosure Document, especially Item 5 for initial fees, Item 6 for other fees, Item 7 for investment ranges, Item 19 for financial performance representations, and Item 20 for outlet and ownership information. The Federal Trade Commission Franchise Rule explains the disclosure framework.
Break-even test: If franchise fees equal 9% of $450,000 revenue, the annual fee burden is approximately $40,500. The franchise must generate enough incremental revenue, improve retention, reduce operating costs, or lower execution risk to justify that amount. Compare the franchise case with an independent case using the same rent, labor, pricing, and capacity assumptions.
Eco-Friendly Positioning and Wet-Cleaning
Wet-cleaning can reduce dependence on solvent handling and may lower equipment and compliance costs, but it is not automatically suitable for every garment or market. Operators should avoid unsupported claims such as “chemical-free,” “zero emissions,” or “safe for every dry-clean-only garment.” The cleaning method, detergent system, garment inspection, operator training, and local rules all matter.
| Positioning | Pricing Approach | Customer Value Proposition | Operational Caution |
|---|---|---|---|
| Standard Hydrocarbon | Baseline local pricing | Convenience, consistency, turnaround time | Requires solvent controls, ventilation, storage, and applicable permits |
| Professional Wet-Cleaning | Potential 5-15% premium where demand supports it | Water-based process, reduced PERC exposure, no solvent odor | Requires specialized finishing skills and careful fabric evaluation |
| Premium Specialty Cleaning | Potential 10-20% premium | High-touch care for luxury or delicate garments | Higher claims risk, labor time, inspection, and insurance requirements |
A premium is a pricing hypothesis that must be tested locally, not an automatic result of using wet-cleaning. The EPA Safer Choice program provides information about safer chemical products, while the EPA PCE risk-management page explains the federal regulatory context for perchloroethylene.
B2B Commercial Contracts: LTV and Revenue Stability
Commercial customers can reduce dependence on walk-in retail demand. Hotels, restaurants, medical facilities, theaters, police departments, and other organizations may provide recurring volume, but contracts also create delivery obligations, payment delays, service-level requirements, and concentration risk.
| Commercial Segment | Illustrative Monthly Revenue | Typical Payment Terms | Three-Year Gross Revenue Example |
|---|---|---|---|
| Hotel | $3,000-$8,000 | Net 30 | $108,000-$288,000 |
| Fine-Dining Restaurant | $800-$2,500 | Net 15-30 | $28,800-$90,000 |
| Medical Clinic | $600-$1,800 | Net 30 | $21,600-$64,800 |
| Police or Fire Department | $2,000-$6,000 | Net 30-45 | $72,000-$216,000 |
| Theater or Performance Venue | $1,500-$4,000 | Net 30 | $54,000-$144,000 |
For a seasonal retailer, a hotel or institutional contract can help cover fixed costs during a slow July when consumer demand for heavy garments is lower. The contract should be evaluated on contribution margin after pickup, delivery, sorting, special handling, rework, billing, and bad-debt risk—not on revenue alone.
Pickup and Delivery Routes
Pickup and delivery can expand the addressable market, but route density determines whether it improves profit. A scattered route with small orders can consume more labor and fuel than it generates. Use a minimum order, delivery fee, recurring schedule, and geographic service zones to protect contribution margin.
| P&D Model | Startup Cost | Typical Cost Structure | Best Use Case |
|---|---|---|---|
| In-House Driver and Van | $35,000-$50,000 | Driver wages, payroll burden, fuel, maintenance, insurance, vehicle financing | Dense local routes with sufficient recurring orders |
| Third-Party Platform | Low initial capital | Revenue share or commission, possible service fees, less control over customer data | Testing demand before buying a vehicle or hiring a driver |
| Route Software | Subscription-based | Scheduling, mapping, customer notifications, route optimization | Businesses with enough stops to justify automation |
Track P&D separately from storefront revenue. The relevant metrics are revenue per route hour, revenue per mile, average order value, stops per hour, repeat-order rate, contribution margin after delivery costs, and customer acquisition cost.
Industry Profitability Trends: 2021-2027
The sector has experienced structural pressure from remote work, changing garment use, labor costs, energy prices, equipment requirements, and environmental regulation. At the same time, industry revenue can rise even while the number of businesses falls if prices increase or larger operators consolidate demand. The historical margin figures below are analytical planning estimates, not audited national averages.
| Year | Independent Net Margin Estimate | Hub-and-Spoke Estimate | Market Indicator | Main Factors |
|---|---|---|---|---|
| 2021 | 14-18% | 20-25% | Recovery year | Reopening demand, temporary support programs, and lower occupancy pressure in some markets |
| 2022 | 13-16% | 19-23% | Cost shock | Inflation, labor shortages, energy volatility, and supply-chain disruption |
| 2023 | 12-15% | 18-22% | Normalization | Higher wages, changed office-wear demand, and growing attention to PERC restrictions |
| 2024 | 11-14% | 17-21% | Consolidation | Rent resets, equipment replacement decisions, and ongoing labor pressure |
| 2025 | 10-14% | 16-20% | Moderate growth | Pricing actions offset some cost inflation, while weaker operators exit or sell |
| 2026 Expected | 10-14% | 18-23% | Stabilization with selective growth | Wet-cleaning adoption, P&D expansion, route density, and continued compliance spending |
| 2027 Forecast | 9-13% | 17-22% | Low-single-digit nominal growth scenario | Labor and compliance costs remain elevated; efficient operators gain share |
IBISWorld’s U.S. dry-cleaner industry analysis reports approximately $9.6 billion in industry revenue for 2025/2026-period estimates and describes a sector with revenue growth alongside business-count pressure. Because private-company margin data are limited, the table should be used as a scenario framework rather than as a claim that every operator experienced the same margin in each year.
Regulatory and Environmental Requirements
Technology choice changes the premises, permitting, waste, insurance, and future-investment profile. Local zoning and fire authorities should approve the proposed use before the lease becomes unconditional.
| Technology | Premises Requirements | Waste and Compliance Profile | Planning Implication |
|---|---|---|---|
| PERC | Specialized ventilation, storage, spill controls, and applicable air-quality approvals | Strict chemical, air-emission, and hazardous-waste requirements | Legacy equipment carries increasing regulatory and resale risk |
| Hydrocarbon | Ventilation, fire protection, compatible electrical systems, and flammable-liquid controls where applicable | Solvent handling, filters, sludge, storage, and waste-hauler requirements | May suit higher-volume production but requires site-specific approval |
| Wet-Cleaning | Commercial water, drainage, electrical service, dryers, and finishing space | Lower solvent-related burden, but wastewater and chemical-management rules still apply | Lower entry cost does not eliminate permitting or technical training |
The EPA’s PCE rulemaking page sets out the federal phaseout framework. For example, Maryland publishes a detailed dry-cleaner compliance calendar, and Minnesota’s environmental agency explains its state requirements for dry cleaners. Requirements vary by state, county, municipality, machine, solvent, building, and waste classification.
State-by-State Cost Considerations
| State | Primary Planning Issue | Likely Cost Pressure | Recommended Verification |
|---|---|---|---|
| California | PCE restrictions, local air districts, Proposition 65, and strict environmental oversight | Permitting, engineering, labor, waste management, and possible site investigation | California Air Resources Board, local air district, DTSC, and city planning department |
| Minnesota | State PCE restrictions and transition to alternative methods | Equipment replacement and technology transition | Minnesota Pollution Control Agency |
| New York | State and local environmental, building, and labor rules | Wages, permits, rent, and compliance | New York State Department of Environmental Conservation and local authority |
| Massachusetts | Environmental and local permitting requirements | Permitting, labor, and property-related costs | Massachusetts Department of Environmental Protection and municipality |
| Washington | State environmental requirements and relatively high labor costs | Payroll, waste, and building compliance | Washington Department of Ecology and local air authority |
| Illinois | State environmental, air, and hazardous-waste requirements | Permits, solvent handling, and labor | Illinois Environmental Protection Agency and local authority |
| Texas | Local zoning, fire, air, wastewater, and waste rules still apply despite lower state-level tax burden | Site-specific construction and utility costs | Texas Commission on Environmental Quality and municipality |
| Florida | Local permitting, flood-zone construction, labor, and seasonal demand | Buildout, insurance, rent, and seasonality | Florida Department of Environmental Protection and local authority |
| Georgia | Local zoning, fire, wastewater, and air-quality review | Site-specific permitting and labor | Georgia Environmental Protection Division and municipality |
| Arizona | Water, wastewater, local zoning, and utility-capacity considerations | Water infrastructure, cooling, and site preparation | Arizona Department of Environmental Quality and municipality |
There is no reliable national table that can assign one universal annual compliance cost to every dry cleaner in a state. Before signing a lease, obtain written confirmation of zoning, permitted use, ventilation, electrical capacity, wastewater discharge, fire protection, hazardous-material storage, and equipment installation requirements.
Minimum Wage and Labor Planning
Minimum wage is only the starting point. Skilled spotting, pressing, route driving, customer service, payroll taxes, workers’ compensation, benefits, overtime, and training can make the fully loaded labor cost substantially higher.
| Labor Scenario | Illustrative Hourly Rate | Illustrative Monthly Gross Payroll for 3 FTE | Planning Note |
|---|---|---|---|
| Federal-Wage Baseline | $7.25 | $3,770 | Calculated as 3 × 40 hours × 4.333 weeks; excludes payroll burden and is not a realistic skilled-labor budget in many markets |
| Moderate Local Wage | $14.00 | $7,279 | Before payroll taxes, insurance, benefits, overtime, and training |
| Higher-Cost Market | $16.90 | $8,579 | Before payroll burden and skilled-worker premiums |
| Skilled Operating Team | $18.00-$22.00 | $9,359-$11,439 | May better reflect experienced pressers, spotters, drivers, and counter staff |
Current wage rules should be checked with the U.S. Department of Labor state minimum-wage resources and the relevant state labor department. The federal minimum is not automatically the applicable rate when a state or municipality has adopted a higher one.
Monthly Operating Expenses and P&L Model
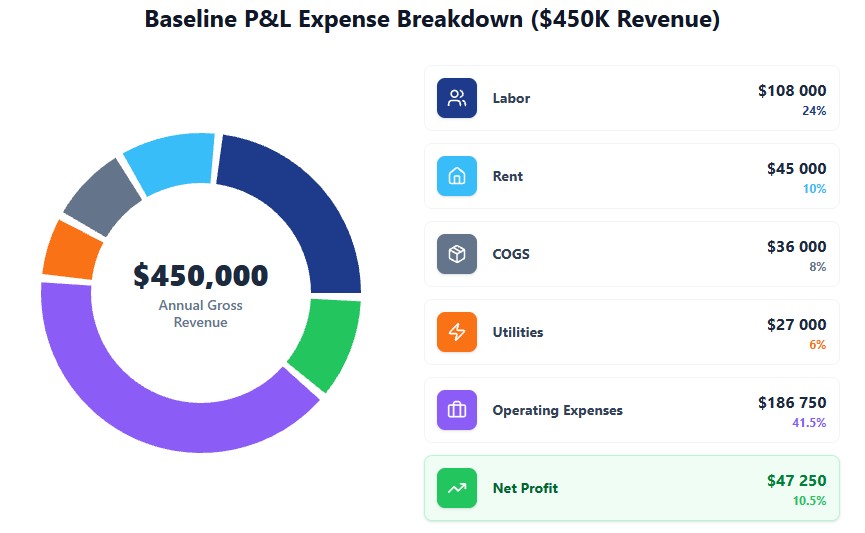
A useful model must distinguish variable processing costs from fixed overhead and owner compensation. The following example uses $450,000 annual revenue, including retail and pickup-and-delivery sales. It is a planning model, not a reported average.
Illustrative Monthly OPEX
| Expense Category | Monthly Amount | Annual Amount | Comment |
|---|---|---|---|
| Labor | $9,000 | $108,000 | Owner-operator plus counter staff and one delivery driver; actual fully loaded labor may be higher |
| Rent | $3,750 | $45,000 | Illustrative 1,500-square-foot site |
| Utilities | $2,250 | $27,000 | Gas, electricity, water, sewer, and climate control |
| Payment Processing | $937.50 | $11,250 | Illustrative 2.5% effective rate; actual terms vary |
| Solvent Distillation and Filters | $750 | $9,000 | Applicable primarily to solvent-based processing |
| Hazardous-Waste Disposal | $187.50 | $2,250 | Depends on solvent, waste classification, volume, and hauler |
| Vehicle, Fuel, and Route Costs | $1,125 | $13,500 | Illustrative P&D reserve; separate driver labor is included above |
| Marketing | $1,125 | $13,500 | Local search, direct mail, paid media, and promotions |
| Insurance, Licenses, and Miscellaneous | $937.50 | $11,250 | General liability, property, permits, and administrative costs |
| Equipment Maintenance Reserve | $500 | $6,000 | Service, parts, boiler, compressor, presses, and unplanned repairs |
| Software and POS | $200 | $2,400 | Garment tracking, customer messaging, POS, and route tools |
| Total Operating Expenses Before COGS | $20,762.50 | $249,150 | Excludes debt service, depreciation, taxes, and owner compensation adjustments |
Illustrative P&L: $450,000 Annual Revenue
| Category | % of Revenue | Annual Amount | Interpretation |
|---|---|---|---|
| Revenue | 100% | $450,000 | $37,500 monthly average |
| Direct Processing Costs | 8% | $36,000 | Solvent, detergents, hangers, packaging, spotting materials, and other direct supplies |
| Gross Profit | 92% | $414,000 | Illustrative blended gross profit before operating overhead |
| Labor | 24% | $108,000 | Includes the owner’s operating role in this planning case |
| Rent | 10% | $45,000 | Occupancy cost |
| Utilities | 6% | $27,000 | Energy and water-intensive production |
| Payment Processing | 2.5% | $11,250 | Card and digital-payment fees |
| Solvent Distillation and Filters | 2% | $9,000 | Separate from direct supply cost in this model; avoid double-counting in actual books |
| Hazardous-Waste Disposal | 0.5% | $2,250 | Applicable waste-handling expense |
| Vehicle, Fuel, and Routes | 3% | $13,500 | Pickup-and-delivery operating cost |
| Marketing | 3% | $13,500 | Customer acquisition and retention |
| Insurance, Licenses, and Miscellaneous | 2.5% | $11,250 | Administrative and risk-management costs |
| Equipment Maintenance Reserve | 1.3% | $6,000 | Annual service and repair reserve |
| Software and POS | 0.5% | $2,400 | Technology infrastructure |
| Total Operating Expenses | 55.3% | $249,150 | Operating expenses excluding direct processing costs and financing |
| Illustrative Operating Profit Before Debt, Tax, and Depreciation | 36.7% | $164,850 | Not equivalent to normalized net profit or owner take-home pay |
Dry Cleaning Earnings Calculator
See how much your shop would actually take home. Every line below matches the article’s baseline P&L for a $450K independent shop — adjust revenue or any cost line to model your own numbers.
Revenue & Core Costs
Operating Expenses
This model demonstrates why dry-cleaner P&Ls must be normalized before comparison. The apparent 36.7% operating profit is high because the model treats only $36,000 as direct processing cost and includes the owner’s labor inside the $108,000 labor line. A conservative underwriting model should also test lower revenue, higher re-clean rates, equipment downtime, claims, debt service, depreciation, taxes, replacement capital, and a market-rate wage for the owner.
Stress Test: Margin Compression
| Scenario | Direct Costs | Rent | Labor | Result Before Financing and Tax |
|---|---|---|---|---|
| Illustrative Baseline | 8% | 10% | 24% | 36.7% operating profit under the model above |
| Higher Direct Costs | 10% | 10% | 24% | Approximately 34.7% before financing and tax |
| Higher Rent | 8% | 14% | 24% | Approximately 32.7% before financing and tax |
| Higher Labor | 8% | 10% | 28% | Approximately 32.7% before financing and tax |
| Combined Pressure | 10% | 14% | 28% | Approximately 26.7% before financing and tax |
For acquisition analysis, calculate normalized SDE or EBITDA separately from the owner’s wage. Otherwise, a business may appear highly profitable simply because the owner is performing production, management, driving, sales, and maintenance work without a market-rate replacement cost.
Break-Even Point and ROI Timeline
Payback depends on the cash invested, financed amount, ramp-up period, working-capital draw, and normalized profit. A simple payback calculation is useful, but it should not be confused with accounting break-even.
| Business Model | Illustrative Initial Investment | Illustrative Monthly Cash Flow After Owner Wage | Planning Payback Range |
|---|---|---|---|
| Drop Shop | $80,000-$250,000 | $5,000-$12,000 | 12-24 months |
| Independent Plant | $175,000-$350,000 | $6,000-$12,000 | 24-48 months |
| Wet-Cleaning Plant | $140,000-$290,000 | $6,000-$12,000 | 18-36 months |
| Franchise Plant | $700,000-$1.5 million | $10,000-$25,000 | 30-60 months |
| Hub-and-Spoke Network | $1.3 million-$2.5 million | $25,000-$45,000 | 36-60 months |
Actual results can be slower when equipment is financed, the store ramps gradually, commercial customers pay on terms, or the owner must replace machinery. Before investing, model three cases: conservative, base, and upside. Include debt service, taxes, replacement reserves, and an owner wage in every case.
Seasonality and Cash Flow
Dry cleaning demand is not evenly distributed across the year. Spring can bring coats, formalwear, graduation events, proms, and weddings, while July may be weaker for garment cleaning as customers travel and wear lighter clothing. Seasonal patterns differ by climate, customer segment, and product mix.
| Period | Typical Demand Pattern | Cash-Flow Response |
|---|---|---|
| Winter | Coats, formalwear, and post-holiday demand vary by climate | Protect cash for uneven retail volume |
| Spring | Coats, events, weddings, proms, and seasonal wardrobe changes | Use peak demand to rebuild reserves and fund maintenance |
| Summer | Potential retail slowdown, travel, and lighter garments | Reduce avoidable labor hours and rely on recurring B2B work |
| Fall and Holiday Season | Businesswear, events, coats, and holiday garments | Plan staffing, supplies, route capacity, and equipment service in advance |
A hotel, theater, medical, restaurant, or uniform contract can help cover fixed expenses during a slow July. The value is not only the contract’s revenue: predictable B2B volume improves production scheduling and makes labor and equipment utilization more stable. However, concentration risk, receivables, delivery requirements, and contract renewal terms must be included in the forecast.