Here’s the truth nobody tells you: your profit & loss statement is a story. Your balance sheet is the evidence.
You can tell investors you had a “great year” with $500K in profit. But if your balance sheet shows $200K of that profit is stuck in unsold inventory and another $150K is owed to you by clients who haven’t paid yet—well, you don’t actually have $500K. You have $150K in cash and a lot of hope.
This guide is built for two types of people:
- Beginners who’ve never looked at a balance sheet and don’t know where to start
- Advanced operators who want CFO-level strategies to optimize their balance sheet for loans, M&A, or investor meetings
We’ll cover everything from “what is an asset?” to “how do I engineer my balance sheet to pass SBA covenant tests?” Plus, I’m introducing three proprietary tools you won’t find anywhere else: the Balance Sheet Health Score, the Cash Flow Trap Detector, and the Working Capital Cycle Optimizer.
Let’s start at the beginning.
Level 1: The Absolute Basics (If You’ve Never Read a Balance Sheet)
What Is a Balance Sheet, Actually?
Think of your business like a person’s net worth statement.
If someone asked, “What’s your personal net worth?” you’d probably:
- Add up everything you own (house, car, cash in the bank, investments)
- Subtract everything you owe (mortgage, car loan, credit card debt)
- What’s left is your net worth
A balance sheet does the exact same thing for your business. It has three sections:
- Assets: Everything your business owns
- Liabilities: Everything your business owes
- Equity: What’s left for the owners (Assets – Liabilities = Equity)
And there’s one rule that never, ever breaks:
Assets = Liabilities + Equity
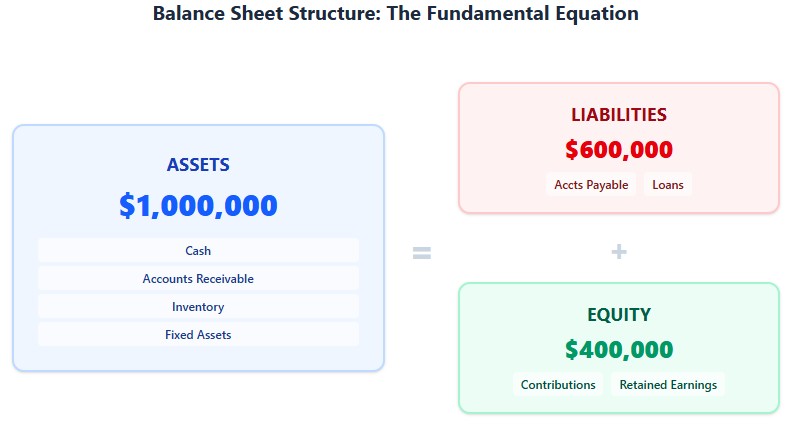
That’s it. That’s the whole equation. If your balance sheet doesn’t balance, something is wrong.
The Five Numbers Every Business Owner Should Check Monthly
You don’t need to memorize your entire balance sheet. But you should know these five numbers by heart:
| Number | What It Is | Why It Matters | Red Flag |
|---|---|---|---|
| 1. Cash Balance | Money in all business bank accounts | Your lifeline. No cash = no payroll = no business. | Declining for 3+ months |
| 2. Accounts Receivable (A/R) | Money customers owe you | Basically an interest-free loan to your customers | Growing faster than sales |
| 3. Inventory | Products you own but haven’t sold | Cash sitting on a shelf | Items unsold for 6+ months |
| 4. Total Debt | Everything you owe (loans, credit cards) | Shows your leverage and risk | Debt > 3x annual profit |
| 5. Owner’s Equity | Your net investment + all historical profits | Your scorecard. Is the business building value? | Negative or shrinking |
Two Ratios That Tell You Everything
If you only calculate two things, make it these:
1. Current Ratio (Can You Pay Your Bills This Year?)
Formula: Current Assets ÷ Current Liabilities
Example:
- Current Assets (cash + A/R + inventory): $150,000
- Current Liabilities (A/P + credit cards + short-term loans): $100,000
- Current Ratio: 1.5x
What it means: You have $1.50 in liquid assets for every $1.00 in bills due this year. Comfortable.
Target: 1.5x or higher. Below 1.0x = crisis.
2. Debt-to-Equity (How Leveraged Are You?)
Formula: Total Liabilities ÷ Total Equity
Example:
- Total Liabilities: $200,000
- Total Equity: $100,000
- Debt-to-Equity: 2:1
What it means: For every dollar of owner investment, you have two dollars of debt. Manageable, but not a lot of room for error.
Target: Below 2:1 for small businesses. Above 4:1 = over-leveraged.
Level 2: Intermediate – Optimizing Your Balance Sheet
Now that you understand the basics, let’s talk about how to make your balance sheet work for you.
The Working Capital Cycle: Your Business’s Cash Flow Engine
Working capital is the cash tied up in your day-to-day operations. It’s the gap between when you pay for inventory/services and when customers pay you.
The Cycle:
- You buy inventory (cash out)
- You sell it on Net-30 terms (no cash in yet)
- Customer pays in 30 days (cash in)
If this cycle is 60 days, you need 60 days of working capital to keep the business running. The shorter the cycle, the less cash you need tied up.
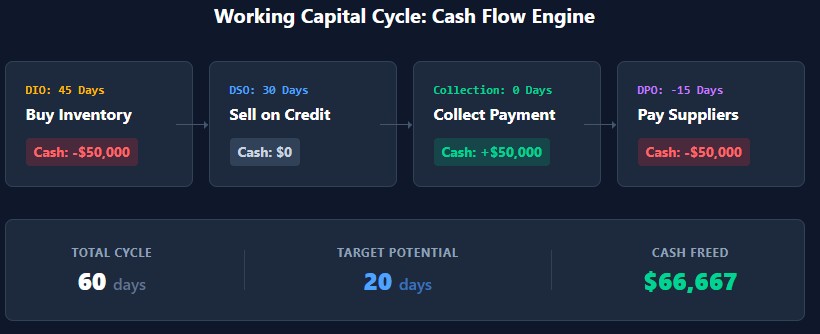
How to Calculate Your Working Capital Cycle
Formula: Days Inventory Outstanding (DIO) + Days Sales Outstanding (DSO) – Days Payable Outstanding (DPO)
Example:
- DIO: You hold inventory for 45 days before selling it
- DSO: Customers pay you in 30 days
- DPO: You pay suppliers in 15 days
- Working Capital Cycle: 45 + 30 – 15 = 60 days
What it means: You need 60 days of cash to fund operations. If your monthly expenses are $50,000, you need $100,000 in working capital (60/30 × $50K).
How to Optimize It
| Lever | Current | Target | Impact |
|---|---|---|---|
| Reduce DIO (sell inventory faster) | 45 days | 30 days | Frees up $25,000 cash |
| Reduce DSO (collect faster) | 30 days | 20 days | Frees up $16,667 cash |
| Increase DPO (pay slower) | 15 days | 30 days | Frees up $25,000 cash |
| Total Cash Freed Up | $66,667 | ||
The Result: By optimizing your working capital cycle from 60 days to 20 days, you free up $66,667 in cash without selling more or raising prices. That’s cash you can use to pay down debt, invest in growth, or build reserves.
Introducing: The Balance Sheet Health Score (0-100)
I’ve developed a proprietary scoring system to evaluate the health of your balance sheet. This is the same framework I use when advising clients before they apply for loans or seek investors.
The Scoring Criteria
| Category | Metric | Excellent (10 pts) | Good (7 pts) | Fair (4 pts) | Poor (0 pts) |
|---|---|---|---|---|---|
| Liquidity | Current Ratio | ≥ 2.0x | 1.5x – 1.99x | 1.0x – 1.49x | < 1.0x |
| Quick Ratio (Cash + A/R ÷ Current Liabilities) | ≥ 1.0x | 0.75x – 0.99x | 0.5x – 0.74x | < 0.5x | |
| Leverage | Debt-to-Equity | < 1.0x | 1.0x – 2.0x | 2.0x – 3.0x | > 3.0x |
| Debt Service Coverage Ratio | ≥ 1.5x | 1.25x – 1.49x | 1.0x – 1.24x | < 1.0x | |
| Asset Quality | A/R > 90 Days (% of Total A/R) | < 5% | 5% – 10% | 10% – 20% | > 20% |
| Inventory > 180 Days (% of Total Inventory) | < 10% | 10% – 20% | 20% – 30% | > 30% | |
| Equity Strength | Equity Growth (YoY %) | ≥ 15% | 10% – 14% | 5% – 9% | < 5% or negative |
| Tangible Net Worth (Equity – Intangibles) | > 50% of Total Assets | 30% – 50% | 10% – 29% | < 10% or negative | |
| Cash Position | Cash Runway (Months of OpEx) | ≥ 6 months | 4 – 5 months | 2 – 3 months | < 2 months |
| Cash Trend (3-Month Avg) | Growing | Stable | Declining < 10% | Declining > 10% |
How to Calculate Your Score
Rate your business on each of the 10 metrics above (0-10 points each). Add them up for a total score out of 100.
Interpretation:
- 90-100: Excellent. You’re in the top 10% of small businesses. Lenders will fight for your business.
- 70-89: Good. Solid financial position, but room for optimization.
- 50-69: Fair. Acceptable, but vulnerable to shocks. Focus on improving liquidity and reducing debt.
- Below 50: Poor. High risk. You need immediate intervention before applying for financing.
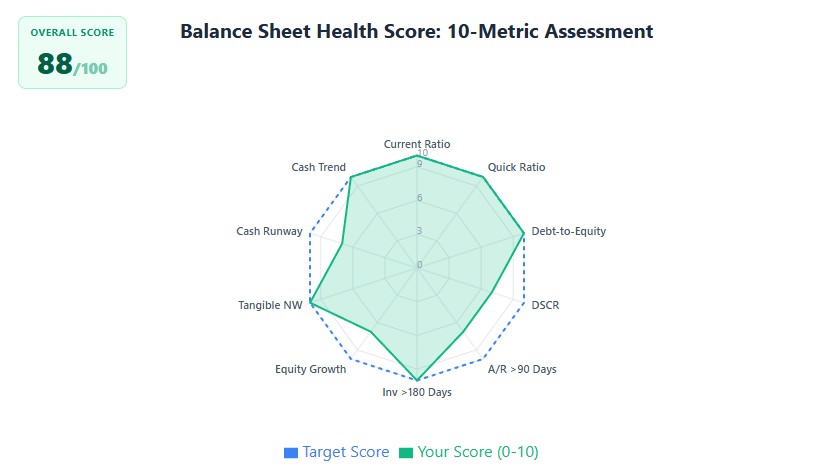
Example: Calculating a Score
Let’s say you’re a marketing agency with these metrics:
| Metric | Your Value | Score |
|---|---|---|
| Current Ratio | 2.5x | 10 |
| Quick Ratio | 1.8x | 10 |
| Debt-to-Equity | 0.8x | 10 |
| DSCR | 1.3x | 7 |
| A/R > 90 Days | 8% | 7 |
| Inventory > 180 Days | N/A (service business) | 10 |
| Equity Growth | 12% | 7 |
| Tangible Net Worth | 85% of assets | 10 |
| Cash Runway | 5 months | 7 |
| Cash Trend | Growing | 10 |
| Total Score | 88/100 |
Interpretation: You’re in the “Good” range (88/100). Strong liquidity and low leverage, but DSCR and A/R aging could be improved. A lender would approve you, but you might not get the absolute best rates.
Level 3: Advanced – CFO-Level Strategies
Now we’re getting into the territory that most small business owners never see. This is how sophisticated operators and CFOs engineer their balance sheets for maximum advantage.
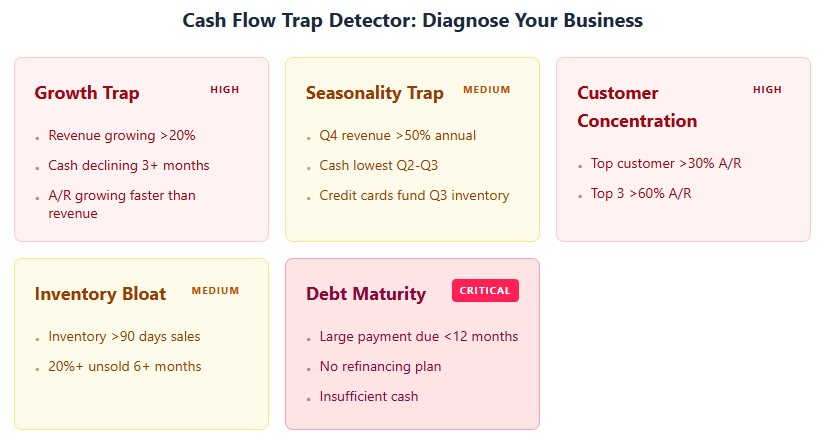
Introducing: The Cash Flow Trap Detector
Most business owners think, “If I’m profitable, I’m fine.” Wrong. Profit ≠ Cash. Here are the five most common cash flow traps that kill profitable businesses:
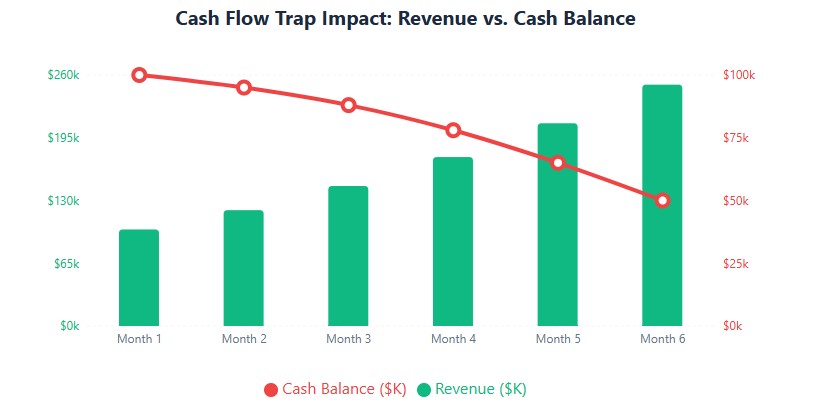
Trap #1: The Growth Trap
What it is: You’re growing sales 30% YoY, but your cash balance is dropping.
Why it happens: Growth requires cash. More sales = more inventory, more A/R, more payroll. If you’re not managing working capital, growth will eat your cash.
How to detect it:
- Revenue growing > 20% YoY
- Cash balance declining for 3+ months
- A/R growing faster than revenue
The fix: Secure a line of credit before you need it. Negotiate longer payment terms with suppliers. Require deposits from large customers.
Trap #2: The Seasonality Trap
What it is: You make 60% of your revenue in Q4, but your expenses are spread evenly all year.
Why it happens: Retailers, e-commerce, and seasonal businesses face cash crunches in Q1-Q3 while waiting for Q4 revenue.
How to detect it:
- Q4 revenue > 50% of annual revenue
- Cash balance lowest in Q2-Q3
- Forced to use credit cards to fund inventory in Q3
The fix: Build a “seasonal reserve” in Q4. Use a line of credit to smooth cash flow. Negotiate seasonal payment terms with suppliers.
Trap #3: The Customer Concentration Trap
What it is: One customer accounts for 40%+ of your A/R.
Why it happens: You’ve built a successful business around a few large clients. But if one goes bankrupt or stops paying, you’re in crisis.
How to detect it:
- Top customer > 30% of A/R
- Top 3 customers > 60% of A/R
The fix: Diversify your customer base. Require deposits or milestone payments from large clients. Consider credit insurance for your biggest accounts.
Trap #4: The Inventory Bloat Trap
What it is: You have $200K in inventory, but $50K of it hasn’t moved in 6+ months.
Why it happens: You over-ordered to get volume discounts, or demand shifted and you’re stuck with obsolete stock.
How to detect it:
- Inventory > 90 days of sales
- 20%+ of inventory unsold for 6+ months
The fix: Run clearance sales on old inventory. Switch to just-in-time ordering. Implement strict inventory management software.
Trap #5: The Debt Maturity Trap
What it is: You have a $500K balloon payment due in 6 months, and you haven’t planned for it.
Why it happens: You took out a 5-year balloon loan and assumed you’d refinance. But rates have risen, or your financials have weakened, and lenders won’t refinance.
How to detect it:
- Large debt payment due within 12 months
- No refinancing plan in place
- Cash balance insufficient to cover payment
The fix: Start refinancing talks 12-18 months before maturity. Build a cash reserve. Consider selling assets to pay down debt.
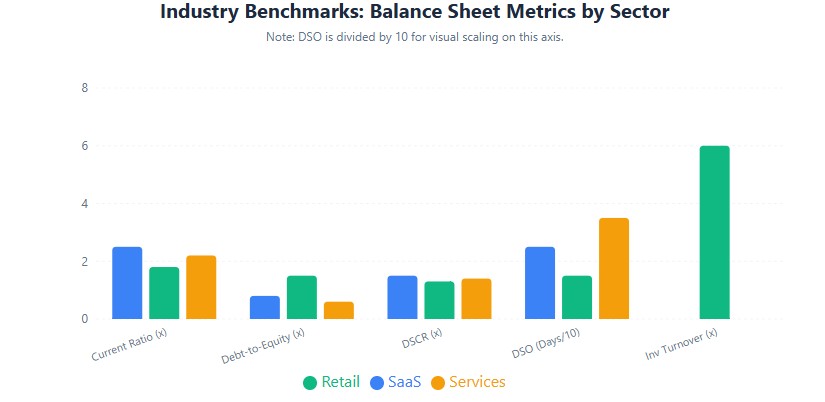
Industry-Specific Balance Sheet Optimization
Your industry dictates what your balance sheet should look like. Here’s how to optimize for the three most common models:
SaaS & Subscription Businesses
The Challenge: Massive deferred revenue (liability) confuses traditional lenders.
The Optimization:
- Track “Cash + Deferred Revenue” as your true liquidity metric
- Calculate “Rule of 40” (Revenue Growth % + Profit Margin %). Target > 40%.
- Present deferred revenue as a positive signal to lenders (upfront cash = pricing power)
Retail & E-Commerce
The Challenge: Heavy inventory ties up cash. Obsolete stock destroys equity.
The Optimization:
- Maintain an “Inventory Reserve” (contra-asset account) to write down dead stock
- Target inventory turnover > 6x per year
- Negotiate consignment arrangements with suppliers where possible
Professional Services & Agencies
The Challenge: High A/R, minimal physical assets. Cash flow depends on collection cycles.
The Optimization:
- Target DSO < 30 days
- Use A/R factoring or lines of credit to bridge cash flow gaps
- Require 50% upfront for projects > $10K
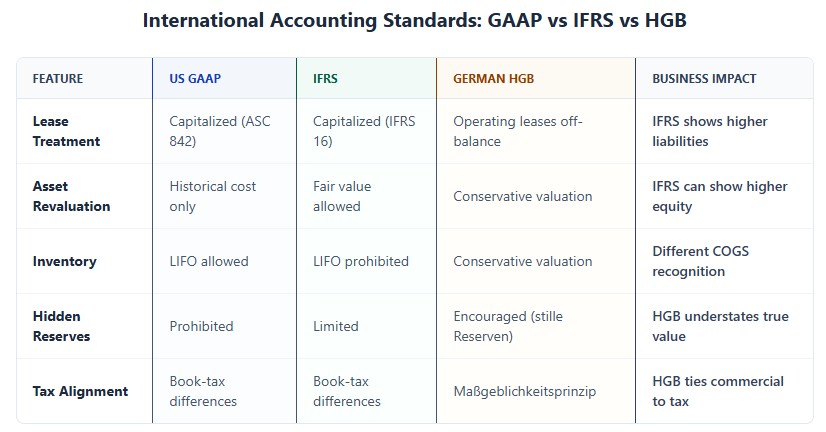
International Accounting: GAAP vs. IFRS vs. German HGB
If you operate globally, seek foreign investment, or acquire overseas targets, you must understand that balance sheets are not universal. The rules change the numbers.
United States: GAAP vs. Tax Basis
In the US, small businesses often file taxes on a “cash basis” or “tax basis,” which differs from GAAP (accrual basis).
- Schedule L (Form 1120-S/1065): This is your tax-basis balance sheet. The IRS requires it to reconcile your book income to your tax income.
- The Depreciation Gap: Under US tax code (Section 179 or Bonus Depreciation), you might deduct a $100,000 equipment purchase entirely in Year 1. On your tax balance sheet, the asset’s value is $0. But on your GAAP/management balance sheet, it’s depreciated over 7 years. Lenders require a “book-to-tax” reconciliation to understand this.
International: IFRS (Europe, UK, Australia, etc.)
International Financial Reporting Standards (IFRS) prioritize “substance over form” and fair value.
- IFRS 16 (Leases): Under IFRS, almost all leases (even operating leases for office space or retail storefronts) must be capitalized. You must record a “Right-of-Use Asset” and a corresponding “Lease Liability.” This massively inflates both your total assets and total liabilities compared to older US GAAP rules, wrecking your debt-to-equity ratio on paper.
- Asset Revaluation: IFRS allows companies to revalue fixed assets (like real estate) to fair market value. US GAAP generally does not. An IFRS balance sheet might show much higher equity if property values have risen.
Germany: HGB (Handelsgesetzbuch) vs. IFRS
If you are a US company acquiring a German Mittelstand (mid-sized) business, you will encounter HGB. It is fundamentally different from US GAAP.
- The Prudence Principle: HGB is extremely conservative. It aims to protect creditors by preventing the overstatement of assets. Companies are encouraged to create stille Reserven (hidden reserves) by undervaluing assets and over-accruing liabilities.
- Maßgeblichkeitsprinzip: Commercial accounting (HGB) is strictly tied to tax accounting. You cannot optimize your tax bill without also lowering your reported commercial profit.
- CFO Insight: When buying a German company, the HGB balance sheet will look weaker and less profitable than reality. You must hire a local firm to prepare an “IFRS bridge” or EBITDA normalization to see the true economic value.
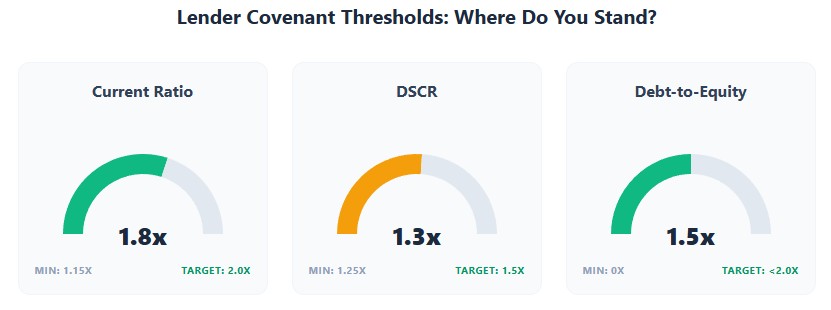
Covenants, DSCR, and Deal-Making: How Lenders Actually Read Your Balance Sheet
When you negotiate a commercial loan or an M&A term sheet, the balance sheet is the foundation of the legal covenants. If you breach them, the lender can call the loan or kill the deal.
How Lenders Calculate Covenant Metrics
| Covenant Metric | How the Bank Calculates It | Typical Requirement | How to Optimize It |
|---|---|---|---|
| Current Ratio | Current Assets ÷ Current Liabilities | ≥ 1.15x to 1.25x | Pay down short-term debt with long-term debt; collect old A/R. |
| Debt Service Coverage (DSCR) | (Net Income + Depreciation + Amortization + Interest) ÷ Total Debt Payments | ≥ 1.25x | Refinance high-interest short-term debt into longer-term amortizing loans. |
| Tangible Net Worth | Total Equity – Intangible Assets (Goodwill, Patents) | Must remain positive | Avoid overpaying for acquisitions that create massive goodwill on your books. |
| Debt-to-Equity | Total Liabilities ÷ Tangible Net Worth | ≤ 2.0x to 3.0x | Inject equity (owner capital) or retain earnings instead of taking draws. |
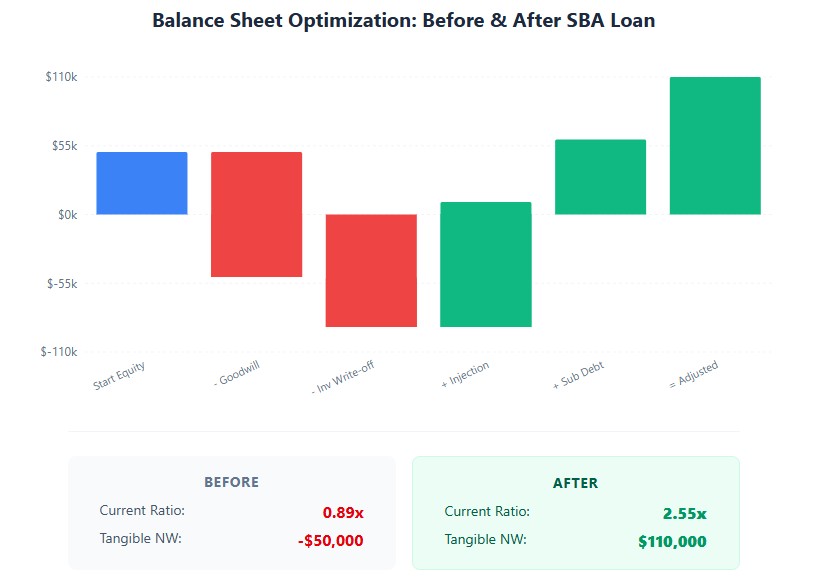
Case Study: “Before & After” Balance Sheet for an SBA Loan
The Scenario: A manufacturing company needs a $1.5M SBA 7(a) loan. The bank’s initial review rejects them because their Tangible Net Worth is too low and their Current Ratio is 0.9x.
The “Before” Balance Sheet (As filed on tax returns):
| Assets | Amount | Liabilities & Equity | Amount |
|---|---|---|---|
| Cash & A/R | $300,000 | Current Liabilities (A/P, Credit Cards) | $350,000 |
| Inventory | $200,000 | Long-Term Debt | $600,000 |
| Fixed Assets (Net) | $400,000 | Owner Equity | $50,000 |
| Goodwill (from past acquisition) | $100,000 | ||
| Total Assets | $1,000,000 | Total Liab + Equity | $1,000,000 |
Bank’s View: Current Ratio = 0.89x (Fail). Tangible Net Worth = $50K – $100K Goodwill = -$50,000 (Fail). Loan denied.
The “After” Balance Sheet (Lender-Adjusted / GAAP Basis):
The CFO works with the CPA to restructure the presentation for the lender.
- Adjustment 1: The owner pays off $100,000 of personal credit cards that were incorrectly mixed with business A/P, using a personal cash injection into the business.
- Adjustment 2: They write off $40,000 of obsolete inventory (reducing assets, but cleaning up the quality of remaining assets).
- Adjustment 3: They remove the $100,000 Goodwill from the books (it was from an acquisition 10 years ago and is unverified).
- Adjustment 4: They reclassify a $50,000 shareholder loan (which the owner agreed to subordinate to the SBA loan) from “Current Liability” to “Long-Term Subordinated Debt” (which can sometimes be counted as quasi-equity by the SBA).
| Adjusted Assets | Amount | Adjusted Liabilities & Equity | Amount |
|---|---|---|---|
| Cash & A/R (Cleaned) | $350,000 | Current Liabilities (Cleaned) | $200,000 |
| Inventory (Net of Reserve) | $160,000 | Long-Term Debt | $600,000 |
| Fixed Assets (Net) | $400,000 | Subordinated Debt (Quasi-Equity) | $50,000 |
| Owner Equity (Adjusted) | $60,000 | ||
| Total Adjusted Assets | $910,000 | Total Adjusted Liab + Equity | $910,000 |
Bank’s New View: Current Ratio = $510K / $200K = 2.55x (Pass). Tangible Net Worth = $60K Equity + $50K Sub Debt = $110,000 (Pass). Loan approved.
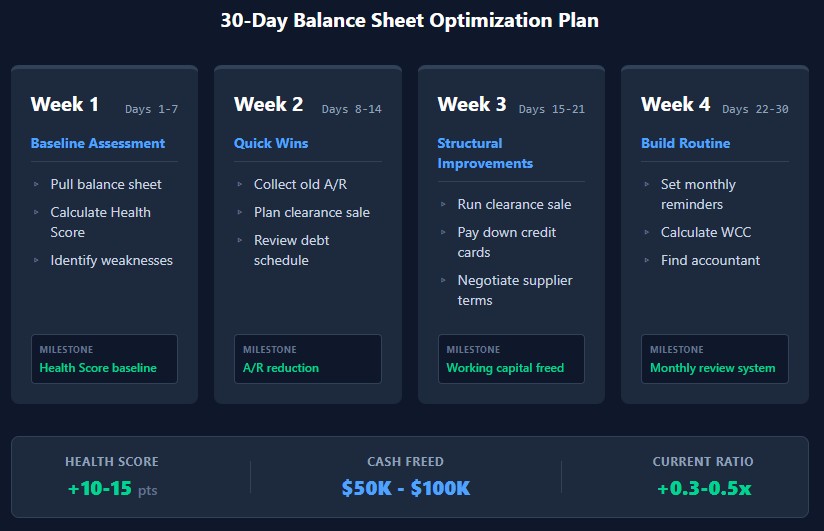
Your 30-Day Action Plan
Week 1: Baseline Assessment
- Day 1-2: Pull your balance sheet from QuickBooks/Xero. If you don’t have accounting software, sign up today.
- Day 3-5: Calculate your Balance Sheet Health Score using the framework above.
- Day 6-7: Identify your top 3 weaknesses (e.g., low current ratio, high A/R aging, bloated inventory).
Week 2: Quick Wins
- Day 8-10: Send reminders to all customers with invoices > 30 days old. Call customers with invoices > 60 days old.
- Day 11-12: Identify inventory that hasn’t sold in 6+ months. Plan a clearance sale.
- Day 13-14: Review your debt schedule. Can you refinance any high-interest short-term debt into longer-term loans?
Week 3: Structural Improvements
- Day 15-17: Run the clearance sale on old inventory. Convert it to cash.
- Day 18-19: Use the cash from the clearance sale (and any A/R you collected) to pay down credit card balances.
- Day 20-21: Negotiate longer payment terms with your top 3 suppliers (e.g., from Net-30 to Net-45).
Week 4: Build a Routine
- Day 22-23: Set up a monthly calendar reminder: “Review balance sheet & calculate Health Score.”
- Day 24-25: Calculate your Working Capital Cycle. Set a target to reduce it by 10 days over the next quarter.
- Day 26-28: If you don’t have an accountant, start looking for one. Ask for recommendations. Interview 2-3 candidates.
- Day 29-30: Generate your month-end balance sheet. Compare your Health Score to your baseline. Celebrate improvements. Make a plan to address remaining weaknesses.
Final Thoughts
Your balance sheet is the most honest document in your business. It doesn’t care about your marketing spin or your sales projections. It tells you exactly where you stand.
If you’re a beginner, start with the basics: understand the five key numbers, calculate your two key ratios, and check your balance sheet monthly.
If you’re advanced, use the proprietary tools in this guide: the Balance Sheet Health Score, the Cash Flow Trap Detector, and the Working Capital Cycle Optimizer. Engineer your balance sheet for loans, M&A, or investor meetings.
Either way, the goal is the same: take control of your financial destiny. Stop reacting to cash flow crises. Start proactively managing your balance sheet like the strategic asset it is.
Your balance sheet is your business’s report card. Make sure it’s one you’re proud to show.
Last Updated: June 2026