Most startup loan repayment models are broken. They treat debt as a static line item, ignore the interaction with SaaS metrics like CAC payback and burn multiple, and fail to automate with real bank feeds. When your variable rate resets or a covenant gets breached, you’re scrambling in Excel instead of having automated alerts.
This guide gives you the CFO-level framework used by growth-stage startups to model debt service alongside SaaS metrics, integrate with Stripe/QuickBooks APIs, and negotiate with lenders from a position of data-driven strength.
Part 1: Advanced Debt Structures Most Founders Ignore
1. Cash Sweep Provisions: The Hidden Liquidity Trap
If your loan has a cash sweep clause, excess cash above a threshold gets automatically applied to principal. This sounds good (faster payoff) but destroys your cash flow flexibility.
Example: Your loan agreement says “50% of Excess Cash Flow above $200K must be applied to principal.”
| Quarter | Cash Balance | Excess Cash | Sweep Amount (50%) | Remaining Cash |
|---|---|---|---|---|
| Q1 | $450,000 | $250,000 | $125,000 | $325,000 |
| Q2 | $380,000 | $180,000 | $90,000 | $290,000 |
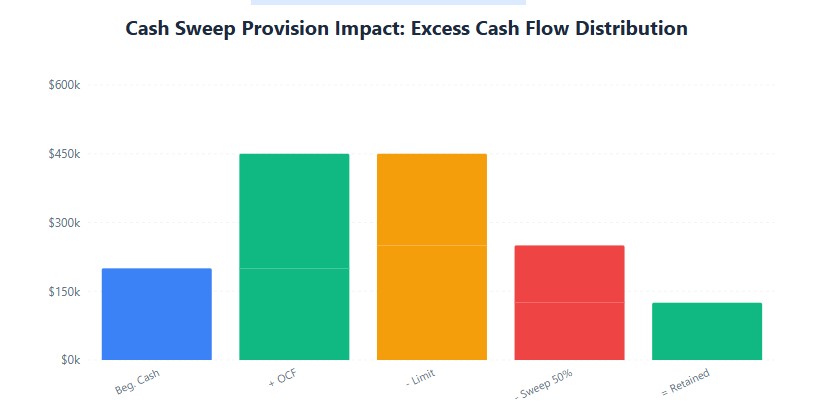
CFO Insight: Banks use cash sweeps to de-risk their exposure. You lose the ability to deploy that cash for growth initiatives (hiring, marketing, R&D). Always negotiate the threshold higher and the sweep percentage lower (target: 25% sweep above $500K).
2. Revolving Credit Lines vs. Term Loans: Modeling the Difference
Term loans are predictable. Revolvers are not. You need to model peak utilization and commitment fees.
Formula for Revolver Costs:
Total Cost = (Utilized Amount × Interest Rate) + (Unused Commitment × Commitment Fee)
Example: $1M Revolver at SOFR + 3.5% with 0.5% Commitment Fee
| Scenario | Utilized | Unused | Interest Cost (8.5%) | Commitment Fee (0.5%) | Total Annual Cost |
|---|---|---|---|---|---|
| Low Utilization | $200K | $800K | $17,000 | $4,000 | $21,000 |
| High Utilization | $800K | $200K | $68,000 | $1,000 | $69,000 |
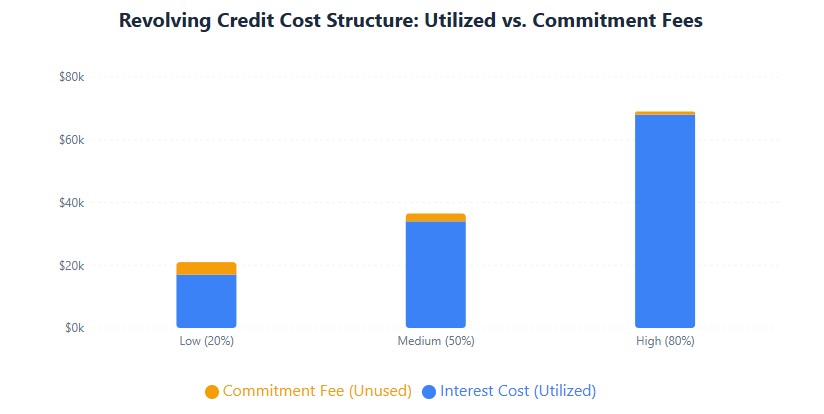
Key Insight: Commitment fees are “dead money” — you pay them whether you use the line or not. Factor this into your runway calculations.
3. Multi-Tranche Debt: Venture Debt & Mezzanine Financing
Growth-stage startups often layer debt: senior secured term loan + mezzanine debt with warrants.
Modeling Warrant Dilution:
If your mezzanine lender gets warrants for 5% of equity at a $20M valuation, that’s $1M of equity value. Over 5 years, that’s $200K/year in implicit cost.
Effective Cost Formula:
Total Cost = Cash Interest + Warrant Value / Term Years
Example: $2M Mezzanine at 12% + 5% Warrants
- Cash Interest: $240K/year
- Warrant Value: $1M / 5 years = $200K/year
- Total Cost: $440K/year = 22% effective rate
CFO Insight: Warrants are expensive. Negotiate them down or cap the valuation at which they’re priced.
Part 2: Integrating SaaS Metrics into Debt Modeling
The SaaS Debt Triangle: CAC Payback, Burn Multiple, Runway
Debt doesn’t exist in a vacuum. It interacts with your core SaaS metrics. Here’s how:
1. CAC Payback Period Impact
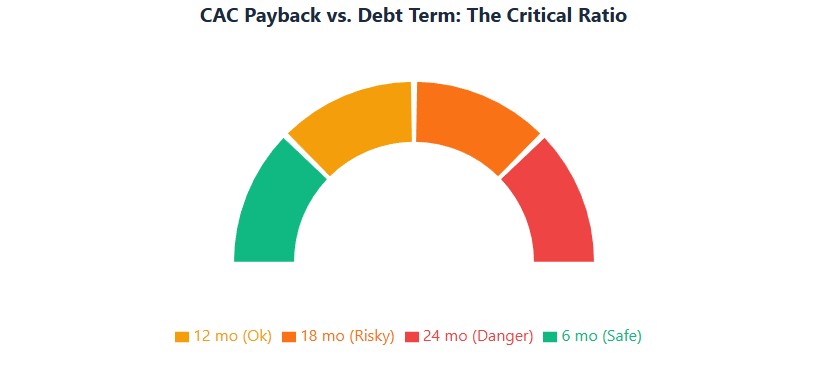
If you use debt to fund customer acquisition, your CAC payback period must be shorter than your debt term.
Formula:
CAC Payback = CAC / (Gross Margin % × Monthly Recurring Revenue per Customer)
Example:
- CAC: $3,000
- ARPU: $500/month
- Gross Margin: 80%
- Monthly Contribution: $400
- CAC Payback: $3,000 / $400 = 7.5 months
Decision Rule: If CAC payback is 7.5 months, you can safely use a 12-month revolver to fund acquisition. If payback is 18 months, you need longer-term debt or equity.
2. Burn Multiple & Debt Service
Your burn multiple (Net Burn / Net New ARR) tells you how efficiently you’re growing. Adding debt service increases your burn.
Adjusted Burn Multiple Formula:
Adjusted Burn = (Operating Burn + Debt Service) / Net New ARR
Example:
| Metric | Without Debt | With $50K/month Debt Service |
|---|---|---|
| Operating Burn | $150K/month | $150K/month |
| Debt Service | $0 | $50K/month |
| Total Burn | $150K/month | $200K/month |
| Net New ARR | $100K/month | $100K/month |
| Burn Multiple | 1.5x | 2.0x |
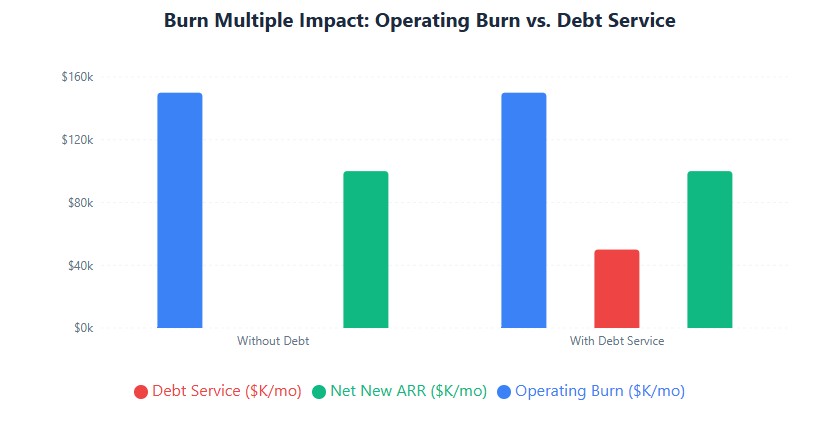
Red Flag: If debt service pushes your burn multiple above 2.0x, you’re in the “danger zone” for venture-backed startups.
3. Runway vs. ARR Growth
Debt can extend runway, but only if used for growth, not operations.
Runway Extension Formula:
Extended Runway = (Debt Proceeds - Debt Service over Period) / Monthly Burn
Example:
- Current Runway: 12 months
- Debt Proceeds: $1M
- Monthly Debt Service: $15K
- Monthly Burn: $100K
- Extended Runway: ($1M – $180K) / $100K = 8.2 additional months
- Total Runway: 12 + 8.2 = 20.2 months
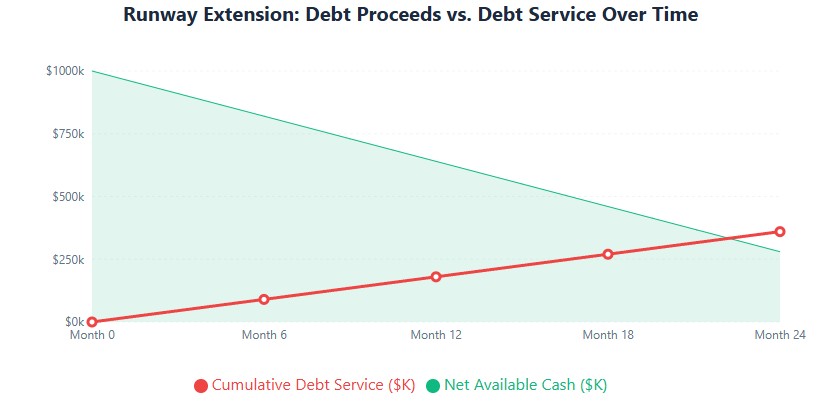
CFO Insight: If you’re using debt just to extend runway without growing ARR, you’re kicking the can. Lenders will see this in your DSCR and pull credit.
Part 3: Automation & Real-Time Monitoring (2026 Stack)
1. Bank Feed Integration: QuickBooks + Stripe + Plaid
Stop manually updating amortization schedules. Connect your systems:
Setup:
- QuickBooks Online → Connect bank feeds via Plaid
- Stripe → Enable auto-sync to QBO
- Lender Portal → Export API key for payment data
Automation Workflow:
- Daily: Bank feeds update cash balance
- Weekly: Stripe revenue syncs to QBO
- Monthly: Lender API pulls payment data → auto-updates amortization schedule
- Real-time: DSCR dashboard recalculates
2. AI-Powered Forecasting Tools
Use AI to predict covenant breaches before they happen:
| Tool | Use Case | Integration |
|---|---|---|
| Puzzle | Cash flow forecasting with ML | QuickBooks, Xero, Stripe |
| Agicap | Debt service tracking & scenario modeling | Bank feeds, Excel export |
| Finmark (by Bill.com) | Startup financial modeling with debt | QuickBooks, Stripe, Shopify |
| LivePlan | Traditional forecasting with loan modules | QuickBooks, Xero |
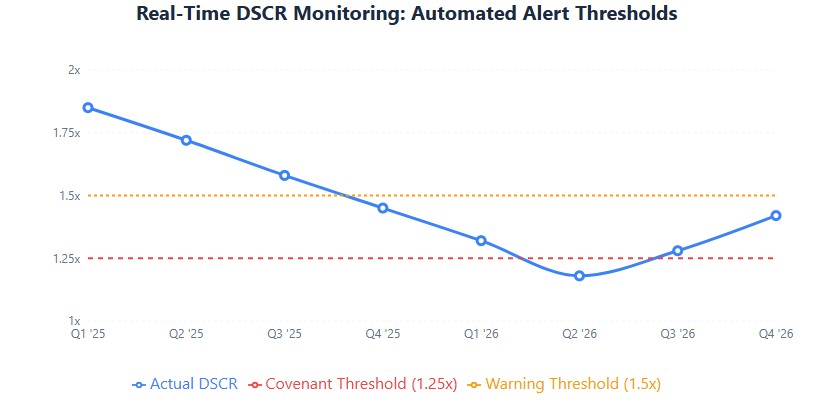
3. Real-Time DSCR Dashboard
Build a dashboard that updates automatically:
Metrics to Track:
- Current DSCR vs. Covenant Threshold
- Projected DSCR (next 3 quarters)
- Debt-to-ARR Ratio
- Months of Cash Runway
- Variable Rate Exposure (% of debt at variable rates)
Alert Triggers:
- DSCR falls below 1.5x → Email CFO
- DSCR falls below 1.25x → Email CEO + Board
- Cash runway < 6 months → Emergency board meeting
Part 4: CFO-Level Insights: How Banks Actually Calculate DSCR
The “Adjusted EBITDA” Game
Banks don’t use your GAAP EBITDA. They use Adjusted EBITDA with add-backs and normalizations.
Common Bank Adjustments:
| Adjustment Type | Example | Bank Treatment |
|---|---|---|
| Owner Compensation | Founder pays self $250K, market rate is $150K | Add back $100K to EBITDA |
| One-Time Expenses | $50K legal fee for patent litigation | Add back to EBITDA (if documented) |
| Related Party Rent | Paying founder’s LLC $20K/month for office (market is $12K) | Add back $8K/month to EBITDA |
| Non-Recurring Revenue | $100K one-time consulting project | Subtract from EBITDA |
| Stock-Based Compensation | $200K in equity grants | Add back (non-cash expense) |
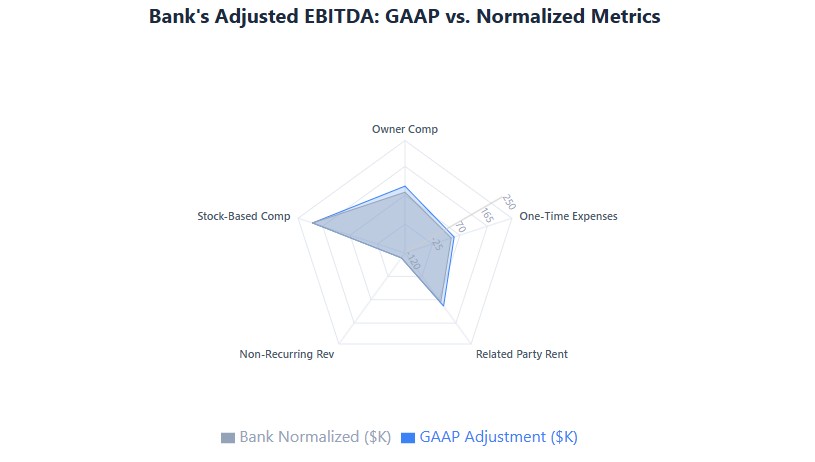
CFO Strategy: Document every add-back with third-party proof (salary surveys, market rent comps, legal invoices). Banks will disallow undocumented adjustments.
How Banks “Normalize” Your Metrics
Banks don’t trust your monthly volatility. They use trailing 12-month (TTM) averages and seasonality adjustments.
Example:
- Your Q4 revenue: $500K (holiday spike)
- Your Q1 revenue: $200K (post-holiday slump)
- Bank’s view: TTM average = $300K/quarter
Implication: Don’t take on debt in Q4 thinking you can service it year-round. Banks will normalize your revenue down.
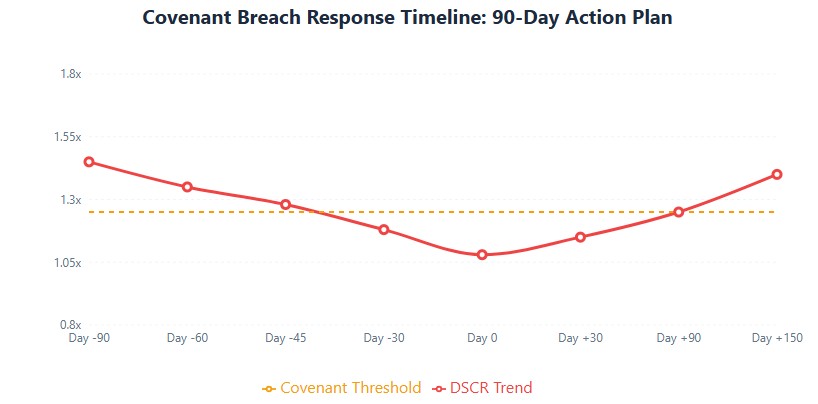
Part 5: Negotiating with Lenders During Covenant Breach
The 3-Step Breach Response Framework
Step 1: Early Detection (90 Days Before Breach)
Your DSCR dashboard shows 1.3x (covenant is 1.25x). You have 90 days.
Actions:
- Model scenarios: What if revenue drops 10%? What if rates rise 1%?
- Identify levers: Can you delay capex? Can you accelerate collections?
- Prepare narrative: “We’re investing in growth, here’s the ROI timeline”
Step 2: Proactive Outreach (60 Days Before Breach)
Contact your relationship manager before you breach.
Script:
“We’re projecting a temporary DSCR dip to 1.15x in Q3 due to [specific reason: seasonal slowdown, strategic investment]. We have a plan to recover to 1.3x by Q4 through [specific actions: cost reduction, revenue acceleration]. Can we discuss a temporary covenant waiver or amendment?”
Why This Works: Lenders prefer proactive borrowers. Surprises trigger default clauses.
Step 3: Negotiation Levers
When you’re in breach (or about to be), you have leverage points:
| Lever | How to Use It | Lender Response |
|---|---|---|
| Prepayment | “We can prepay $100K if you grant a 6-month waiver” | Lender gets cash now, you get breathing room |
| Additional Collateral | “We’ll pledge our AR as additional security” | Reduces lender risk, may get covenant relief |
| Personal Guarantee | “Founder will provide limited PG for 12 months” | Shows commitment, lender may defer action |
| Equity Injection | “We’re raising $500K equity, will use $200K to pay down debt” | Improves DSCR, lender may restructure |
Real Negotiation Example
Situation: SaaS startup, DSCR fell to 1.08x (covenant 1.25x) due to customer churn.
Negotiation:
- CEO contacted lender 45 days before reporting date
- Provided 13-week cash flow forecast showing recovery to 1.3x
- Offered to prepay $50K from recent equity raise
- Requested: 6-month covenant waiver + quarterly reporting
Outcome: Lender granted waiver, increased reporting frequency, no default. Startup recovered DSCR to 1.4x in 5 months.
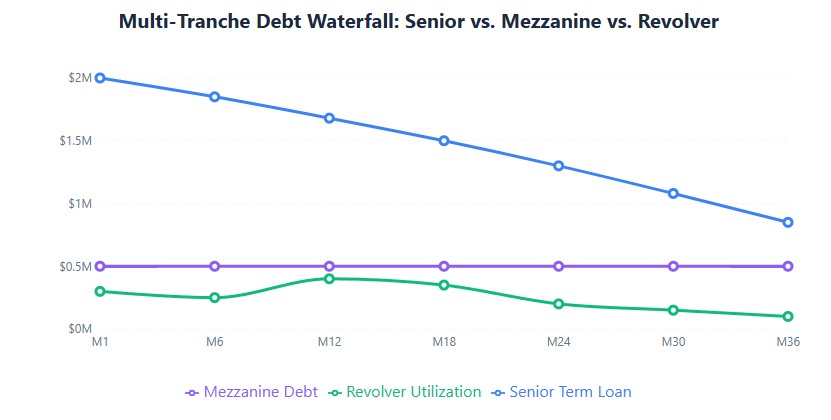
Part 6: Advanced Modeling Templates & Formulas
1. Multi-Tranche Debt Waterfall
When you have senior debt + mezzanine + revolver, model the payment waterfall:
| Tranche | Amount | Rate | Priority | Monthly Payment |
|---|---|---|---|---|
| Senior Term Loan | $2M | 7.5% | 1st | $23,840 |
| Mezzanine Debt | $500K | 12% | 2nd | $5,000 |
| Revolver (utilized) | $300K | SOFR+3.5% | 1st (same as senior) | $2,125 |
| Total | $2.8M | Blended: 8.9% | — | $30,965 |
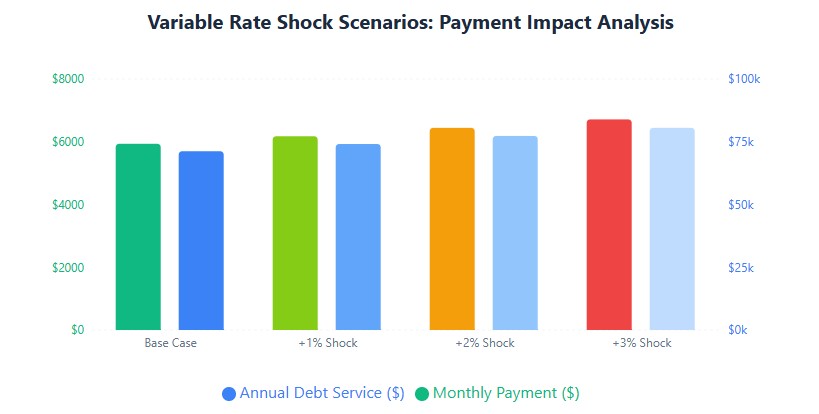
2. Dynamic Amortization with Rate Resets
For variable-rate loans, build a toggle for rate scenarios:
Excel Formula:
=PMT((SOFR_Cell + Spread_Cell)/12, Remaining_Term, -Remaining_Balance)
Scenario Table:
| Scenario | SOFR | Spread | Effective Rate | Monthly Payment | Annual Impact |
|---|---|---|---|---|---|
| Base Case | 4.5% | 3.5% | 8.0% | $5,935 | $71,220 |
| Rate Shock +2% | 6.5% | 3.5% | 10.0% | $6,443 | $77,316 |
| Rate Shock +3% | 7.5% | 3.5% | 11.0% | $6,712 | $80,544 |
3. Covenant Compliance Calculator
Build a dashboard that auto-calculates:
Inputs:
- TTM EBITDA (from QBO)
- Capex (from cash flow statement)
- Taxes paid (from tax returns)
- Total debt service (from amortization schedule)
Formula:
DSCR = (TTM EBITDA - Capex - Taxes) / Total Debt Service
Alert Logic:
- IF DSCR < 1.25x → "WARNING: Covenant breach risk"
- IF DSCR < 1.15x → "CRITICAL: Immediate action required"
- IF DSCR > 1.5x → “HEALTHY: Consider refinancing or prepayment”
Part 7: The 2026 Tech Stack for Loan Modeling
Essential Tools
| Category | Tool | Cost | Key Feature |
|---|---|---|---|
| Accounting | QuickBooks Online Advanced | $180/month | Custom reporting, API access |
| Bank Feeds | Plaid | $0.60/connection | Real-time bank data sync |
| Forecasting | Puzzle | $299/month | ML-powered cash flow predictions |
| Debt Tracking | Agicap | $199/month | Automated DSCR calculation |
| Scenario Modeling | Finmark | $149/month | SaaS metrics + debt integration |
Integration Workflow
Step-by-Step Setup:
- Connect QuickBooks to Plaid: Enable real-time bank feeds
- Link Stripe to QBO: Auto-sync revenue data
- Export lender API credentials: Pull payment data automatically
- Set up Puzzle/Agicap: Connect to QBO for forecasting
- Build DSCR dashboard: Pull data from all sources
- Configure alerts: Email/SMS when DSCR < 1.5x
Time to Set Up: 4-6 hours
Ongoing Maintenance: 30 minutes/month
Part 8: Common Mistakes & How to Avoid Them
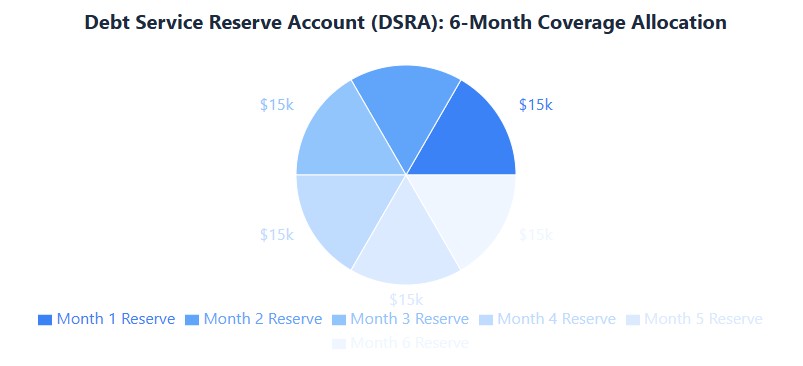
Mistake 1: Ignoring the “Debt Service Reserve”
Problem: You model debt service but don’t set aside cash for it.
Solution: Maintain a Debt Service Reserve Account (DSRA) with 3-6 months of payments.
Example:
- Monthly debt service: $15K
- DSRA target: $15K × 6 = $90K
- Keep this in a separate, non-operating account
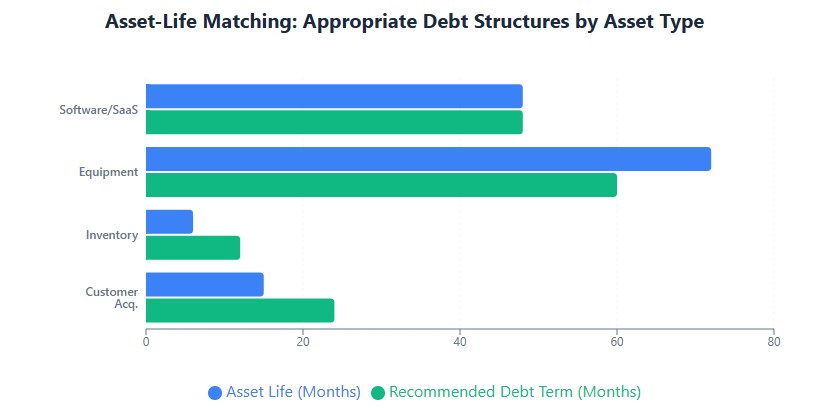
Mistake 2: Using Short-Term Debt for Long-Term Assets
Problem: You use a 12-month revolver to fund equipment that lasts 5 years.
Solution: Match asset life to debt term.
| Asset Type | Useful Life | Appropriate Debt |
|---|---|---|
| Software/SaaS | 3-5 years | 3-5 year term loan |
| Equipment | 5-7 years | 5-7 year equipment loan |
| Inventory | 3-6 months | Revolver or 12-month term |
| Customer Acquisition | 12-18 months (CAC payback) | 18-24 month term loan |
Mistake 3: Not Modeling Prepayment Scenarios
Problem: You get a cash windfall but don’t know if prepaying debt makes sense.
Solution: Build a prepayment calculator.
Formula:
Prepayment Benefit = (Remaining Interest - Prepayment Penalty) / Prepayment Amount
Decision Rule:
- If benefit > your cost of capital → Prepay
- If benefit < cost of capital → Invest elsewhere
Next Steps: Build Your Advanced Model Today
- Audit your current debt: Pull all promissory notes, list tranches, rates, covenants
- Build the multi-tranche waterfall: Model senior, mezzanine, revolver separately
- Integrate SaaS metrics: Calculate CAC payback, burn multiple, runway with debt service
- Set up automation: Connect QuickBooks, Plaid, Stripe for real-time data
- Build DSCR dashboard: Auto-calculate with alerts at 1.5x and 1.25x
- Stress-test: Model +2% and +3% rate shocks, 20% revenue decline
- Prepare negotiation playbook: Document your levers (prepayment, collateral, PG) before you need them
Debt is a tool, not a trap. But only if you model it with the sophistication it demands. Build this framework, and you’ll negotiate with lenders from strength, not desperation.