In 2026, the era of cheap capital is dead. With the cost of startup debt hovering between 7% and 10%, and VC equity more expensive than ever, your working capital is the only free leverage you have left.
Most B2B startup founders treat Accounts Receivable (AR) and Accounts Payable (AP) as an afterthought—something the bookkeeper handles at month-end. This is a fatal mistake. If you are forecasting cash flow based on the invoice date rather than the actual collection date, your financial model is lying to you.
This guide is built for B2B startup founders and fractional CFOs who need to build bulletproof, GAAP-compliant AR and AP forecasts. We will cover how to model enterprise payment delays, how to handle the CECL (ASC 326) bad debt requirement when you have zero historical data, and how to build a 13-week cash flow model that will satisfy any SBA lender or Series B investor.
The B2B Startup Cash Conversion Cycle (CCC) Reality Check
Your Cash Conversion Cycle dictates how many days your cash is trapped in operations. The formula is simple:
CCC = Days Sales Outstanding (DSO) + Days Inventory Outstanding (DIO) – Days Payable Outstanding (DPO)
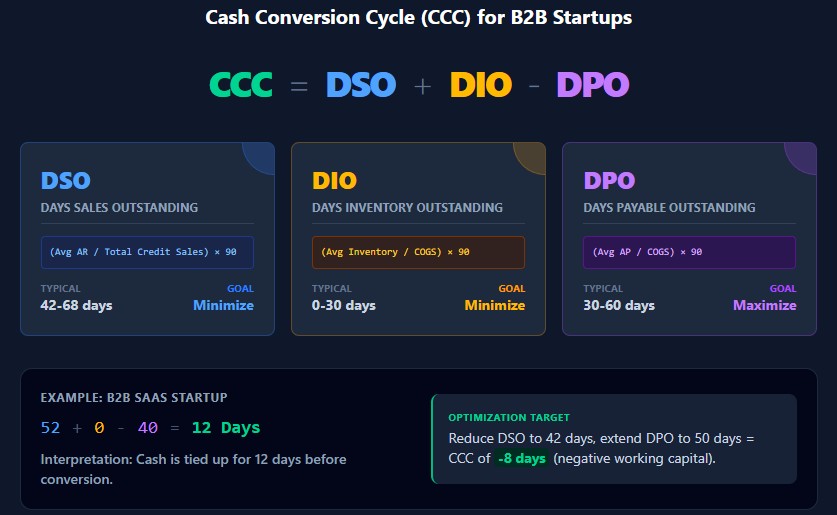
For a B2B SaaS or tech-enabled services startup, DIO is near zero. Your battle is entirely between DSO and DPO.
The “Term Sheet Illusion”
Here is the most common forecasting error: Your sales team closes a deal with “Net 30” terms. You model the cash inflow for Day 30. But enterprise AP departments operate on their own schedules. They process payments in batches on the 15th and 30th of the month. Your Net 30 invoice actually gets paid on Day 45 or Day 52.
The Fix: Stop forecasting based on contract terms. Forecast based on historical payment behavior. If your enterprise clients historically pay in 52 days, your model must use a 52-day DSO, regardless of what the contract says. This creates a realistic “cash lag” buffer.
How to Forecast AR: Beyond the Basic DSO Formula
The standard DSO formula (Average AR / Total Credit Sales × Days) is useless for a 13-week cash flow forecast. It gives you an average, but cash flow requires timing.
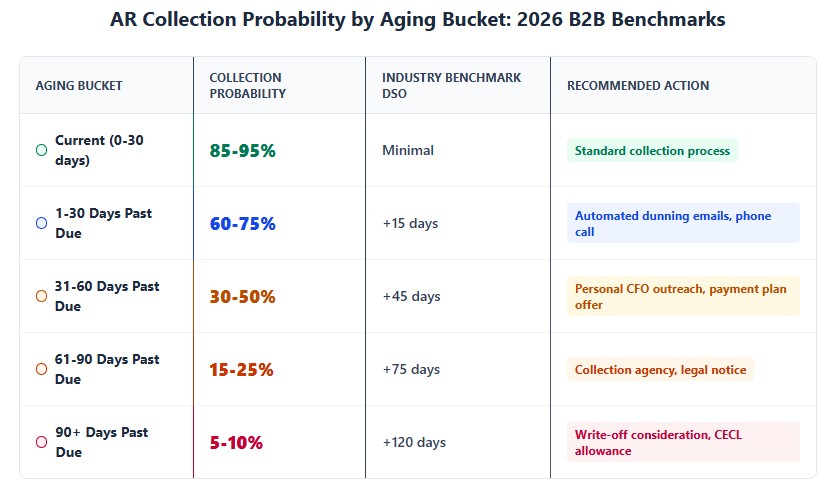
Aging Bucket Probability Modeling
To forecast exactly when cash will hit your bank account, you must segment your AR into aging buckets and apply historical collection probabilities.
| Aging Bucket | Current AR Balance | Historical Collection Rate | Expected Cash Inflow | Probability of Default |
|---|---|---|---|---|
| Current (0-30 days) | $150,000 | 85% collected in bucket | $127,500 | 0.5% |
| 1-30 Days Past Due | $60,000 | 60% collected in bucket | $36,000 | 2.0% |
| 31-60 Days Past Due | $25,000 | 30% collected in bucket | $7,500 | 8.0% |
| 61-90 Days Past Due | $10,000 | 15% collected in bucket | $1,500 | 25.0% |
| 90+ Days Past Due | $5,000 | 5% collected in bucket | $250 | 80.0% |
| Total Expected Collections | $250,000 | $172,750 |
CFO Insight: Notice that out of $250,000 in outstanding invoices, you only expect to collect $172,750 in the current forecasting period. The remaining $77,250 rolls forward into future buckets or becomes bad debt. This is how you prevent cash flow surprises.
The CECL (ASC 326) Problem: Estimating Bad Debt with Zero History
If you are raising Series A or B capital, your investors will demand GAAP-compliant financials. Under ASC 326 (Current Expected Credit Losses), you must maintain an allowance for doubtful accounts.
The Startup Dilemma: How do you calculate expected credit losses when you are a Seed-stage startup with zero historical defaults?
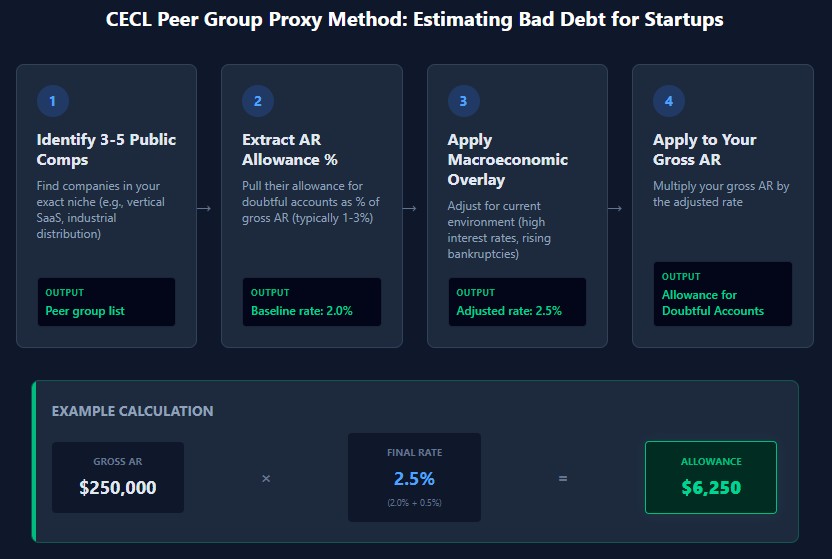
The Solution: The Peer Group Proxy Method.
- Identify 3-5 publicly traded companies or mature private comps in your exact niche (e.g., vertical SaaS, industrial distribution).
- Extract their AR allowance as a percentage of total gross AR (typically 1% to 3% for healthy B2B tech).
- Apply that percentage to your gross AR.
- Macroeconomic Overlay: Adjust the rate up or down based on the current economic environment. In a high-interest-rate environment with rising B2B bankruptcies, add a 0.5% risk premium to your proxy rate.
How to Forecast AP: Strategic DPO Extension
Forecasting AP is not just about recording bills; it is about cash retention strategy. Every day you hold onto cash is a day you don’t need to draw on your venture debt line.
The Payment Run Optimization Matrix
Should you pay on Day 10 to get a 2% discount, or Day 45 to preserve cash? It depends entirely on your cost of capital.
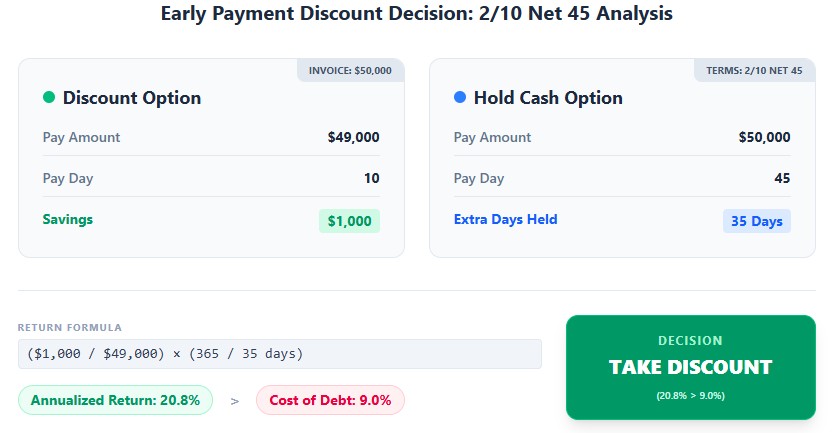
Example Scenario: You have a $50,000 server hosting bill. Terms are 2/10 Net 45.
- Option A (Take Discount): Pay $49,000 on Day 10. You save $1,000.
- Option B (Hold Cash): Pay $50,000 on Day 45. You hold the cash for an extra 35 days.
The Math: Saving $1,000 on a $49,000 payment over 35 days annualizes to a 20.8% risk-free return on your cash. If your startup’s cost of debt is 9%, you should always take the 2% discount. Your AP forecast must automatically flag these high-yield early payment opportunities.
Mapping AP to the 13-Week Model
Do not forecast AP by the invoice date. Forecast AP by the cash disbursement date. If you have a Net 30 policy, but your CFO only approves payment runs every Friday, your actual DPO might be 34 days. Model the 34 days.
The 13-Week Cash Flow Forecast: The Ultimate B2B Startup Template
This is the exact model SBA lenders and VC investors want to see. It bridges the gap between your P&L (accrual) and your bank account (cash).
| Category | Week 1 | Week 2 | Week 3 | Week 4 | Weeks 5-13 (Avg/Wk) |
|---|---|---|---|---|---|
| Beginning Cash Balance | $150,000 | $115,000 | $142,000 | $128,000 | $160,000 |
| Cash Inflows (AR Collections) | |||||
| Current Bucket Collections | $40,000 | $45,000 | $42,000 | $48,000 | $50,000 |
| Past Due Bucket Collections | $15,000 | $10,000 | $12,000 | $8,000 | $5,000 |
| Total Cash In | $55,000 | $55,000 | $54,000 | $56,000 | $55,000 |
| Cash Outflows (AP & OpEx) | |||||
| Vendor Payments (AP Disbursements) | ($30,000) | ($22,000) | ($45,000) | ($28,000) | ($32,000) |
| Payroll & Contractors | ($55,000) | ($55,000) | ($15,000) | ($55,000) | ($45,000) |
| SaaS & Overhead | ($5,000) | ($6,000) | ($8,000) | ($5,000) | ($6,000) |
| Total Cash Out | ($90,000) | ($83,000) | ($68,000) | ($88,000) | ($83,000) |
| Ending Cash Balance | $115,000 | $87,000 | $128,000 | $96,000 | $132,000 |
Analysis: In Week 2, cash drops to $87,000 because a large AP batch ($45K) is due in Week 3, but the corresponding AR collections from that project won’t hit until Week 4. This is a classic timing gap. If you didn’t forecast this, you might miss payroll. Because you did, you draw $20K on your line of credit in Week 2 and pay it back in Week 4.
US GAAP and IRS Compliance: The Audit Triggers
Forecasting isn’t just about survival; it’s about compliance. The IRS and state tax authorities use your AR and AP data to verify your tax liability.
ASC 606: Revenue Recognition vs. Cash Inflow
If you sell a $120,000 annual SaaS contract upfront, GAAP (ASC 606) requires you to recognize $10,000 in revenue each month. However, your cash flow forecast must show the full $120,000 inflow in Month 1.
The Trap: If you confuse your P&L revenue forecast with your cash flow forecast, you will severely understate your cash position in Month 1 and overstate it in Months 2-12. Always separate the billing schedule from the revenue recognition schedule.
IRC Section 166: The “Worthlessness” Standard for Bad Debt
You cannot simply write off an invoice as bad debt on your tax return just because it is 90 days past due. Under IRC §166, the debt must become wholly or partly worthless.
Substantiation Requirements: To claim a bad debt deduction, the IRS requires proof of your collection efforts. You must retain:
- Demand letters sent via certified mail.
- Logs of phone calls to the debtor.
- Evidence of the debtor’s bankruptcy filing or business closure.
- If the cost of collection exceeds the debt amount, a memo documenting this economic reality.
If you write off $50,000 in AR without this documentation, the IRS will disallow the deduction, assess back taxes, and apply negligence penalties.
1099-NEC vs. AP Accruals: The Timing Mismatch
The IRS receives copies of all 1099-NEC forms you issue. If your AP ledger shows you paid a contractor $80,000, but you only issued a 1099-NEC for $60,000 (perhaps because $20,000 was paid to a different entity or was a reimbursed expense under an accountable plan), the IRS automated matching system will flag the discrepancy.
The Fix: Reconcile your 1099-NEC issuance report directly against your AP disbursement ledger every January. Ensure every vendor paid >$600 has a valid W-9 on file before the first payment is made.
State-Specific Tax Traps: Nexus and Franchise Taxes
Your AR and AP forecasting directly impacts your state tax liabilities, especially if you operate in multiple states.
- Texas Franchise Tax: Texas does not have a corporate income tax, but it levies a Franchise Tax on “taxable margin.” If you elect the “Cost of Goods Sold” (COGS) or “Compensation” method to calculate your margin, the timing of your AP accruals (when you recognize COGS) directly impacts your tax bill. Accrual-basis filers must forecast their Texas tax liability based on incurred expenses, not just cash paid.
- California FTB: California imposes an $800 minimum franchise tax on all LLCs and Corporations, regardless of cash flow or profitability. Furthermore, if you are an accrual-basis taxpayer, uncollected receivables from California clients still count toward your apportionment factor, meaning you could owe California income tax on revenue you haven’t actually collected in cash yet.
- New York Corporate Franchise Tax: New York requires careful tracking of where your B2B services are “delivered.” If your AR aging shows massive balances from NY clients, ensure your sales tax collection (if applicable to your specific B2B service) is accurately accrued and remitted.
The 2026 B2B Startup Tech Stack for AR/AP Automation
Spreadsheets break when you scale. In 2026, B2B startups use integrated tech stacks to automate the 13-week forecast.
| Tool Category | Top Platforms (2026) | Core Forecasting Capability | Best For |
|---|---|---|---|
| FP&A / Cash Flow Modeling | Jirav, Fathom, Pulse | Automated 13-week cash flow, scenario modeling, DSO/DPO tracking. | Seed to Series B startups needing investor-ready models. |
| AP Automation & Payments | Bill.com, Ramp, Melio | Virtual card float extension, automated payment scheduling, DPO optimization. | Startups wanting to extend DPO without damaging supplier relationships. |
| AR Automation & Collections | HighRadius, Chaser, Upflow | Automated dunning emails, payment portal, predictive collection scoring. | B2B startups with high transaction volumes and complex aging buckets. |
| Core ERP / Accounting | NetSuite, QBO Advanced, Sage Intacct | The source of truth. GAAP compliance, ASC 606/326 modules. | The foundation that feeds all other forecasting tools. |
Your 30-Day Action Plan to Fix Your Working Capital
If your cash flow forecast is currently just a P&L with a plug figure, you are flying blind. Execute this 30-day plan to build a institutional-grade forecasting engine.
Week 1: Clean the AR Aging and Establish DSO Reality
- Export your AR aging report. Identify the top 10 clients by balance.
- Call your finance contacts at those companies. Ask directly: “What is your current AP processing cycle?”
- Update your forecasting model to use their actual payment days, not the contract Net 30/60 terms.
Week 2: Map AP to Cash Disbursement Dates
- Export your AP aging and vendor terms.
- Identify all vendors offering early pay discounts (e.g., 2/10 Net 30). Calculate the annualized yield. If it beats your cost of capital, schedule those payments for Day 9.
- For all other vendors, push payment to the exact due date. Stop paying on Day 15 out of habit.
Week 3: Build the 13-Week Cash Flow Model
- Open the HTML/Excel template provided in this guide.
- Hardcode your beginning cash.
- Map Week 1-13 AR collections using the Aging Bucket Probability method.
- Map Week 1-13 AP disbursements based on your optimized payment schedule.
Week 4: Stress-Test and Automate
- Run a downside scenario: What if DSO increases by 15 days next month? What if your largest client goes bankrupt (triggering your CECL allowance)?
- Connect your accounting software (NetSuite/QBO) to an FP&A tool like Jirav or Fathom to automate the data feed.
- Institute a rule: The CFO reviews and updates the 13-week forecast every single Friday morning.
Final Thoughts
Profit is a theory. Cash is a fact. In the B2B startup world, the companies that survive aren’t always the ones with the best product; they are the ones that accurately predict when the money will arrive and when the bills must be paid. By mastering your AR and AP forecasting, you transform your finance function from a historical record-keeping department into a strategic weapon for growth.