What is the formula for overhead and profit in construction bids?
Bid Price = (Direct Costs + Labor Burden) × (1 + Overhead %) × (1 + Profit %) + Risk Allowance
Overhead % = Annual Overhead ÷ Total Direct Costs
Profit % = Target margin based on risk and project type
Getting the construction bid formula right isn’t about adding a quick percentage at the end. It’s about understanding what actually drives your costs and pricing risk appropriately. Industry data shows contractors who misclassify overhead or ignore labor burden consistently underbid projects by 15-30%. This guide walks through how to estimate construction costs accurately, with a contractor bid example you can adapt to your operations.
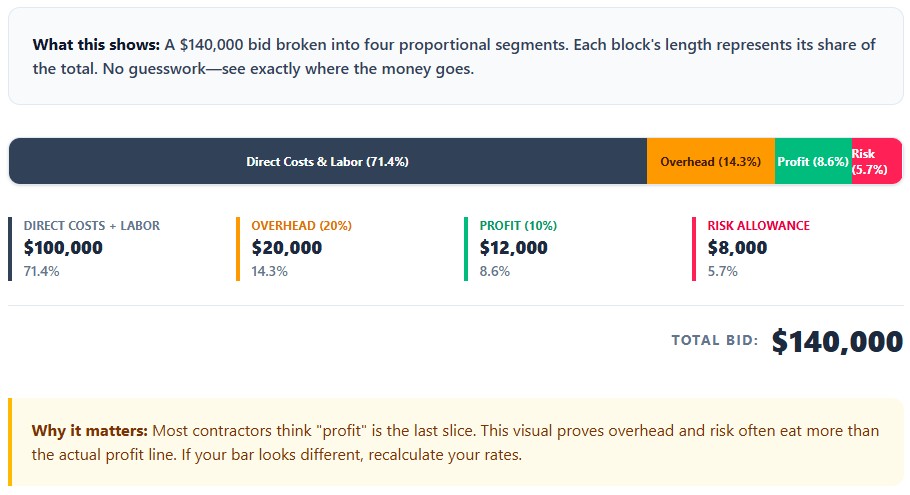
Example: Full Construction Bid Calculation
Materials: $50,000
Direct Labor: $40,000
Labor Burden (25%): $10,000
Total Direct Costs: $100,000
Overhead (20%): $20,000
→ Subtotal: $120,000
Profit (10%): $12,000
Risk Allowance: $8,000
Final Bid Price: $140,000
Step 1: Separate Direct Costs from Overhead
Rule: If the cost disappears when the project ends → Direct Cost. If the cost continues → Overhead.
| Cost Item | Classification | Impact on Bid |
|---|---|---|
| Owner’s on-site labor | Direct | Add to project labor total |
| Owner’s office/admin time | Overhead | Factor into overhead % rate |
| Vehicle used exclusively on job | Direct | Include in equipment costs |
| Vehicle for general company use | Overhead | Spread across all projects |
| Project-specific software license | Direct | Bill to that job |
| Company-wide software subscription | Overhead | Include in overhead pool |
Misclassifying these items distorts your overhead percentage construction rate and leads to systematic underpricing. Keep a written policy and review it quarterly.
Step 2: Calculate Labor Burden Correctly
Labor Burden Rate = (Total Labor Costs – Base Wages) ÷ Base Wages
Burdened Hourly Rate = Total Labor Cost ÷ Productive Hours
Mini-example:
Base Wage: $30/hour
Real Cost (with taxes, insurance, benefits, downtime): $45/hour
→ Burden = 50%
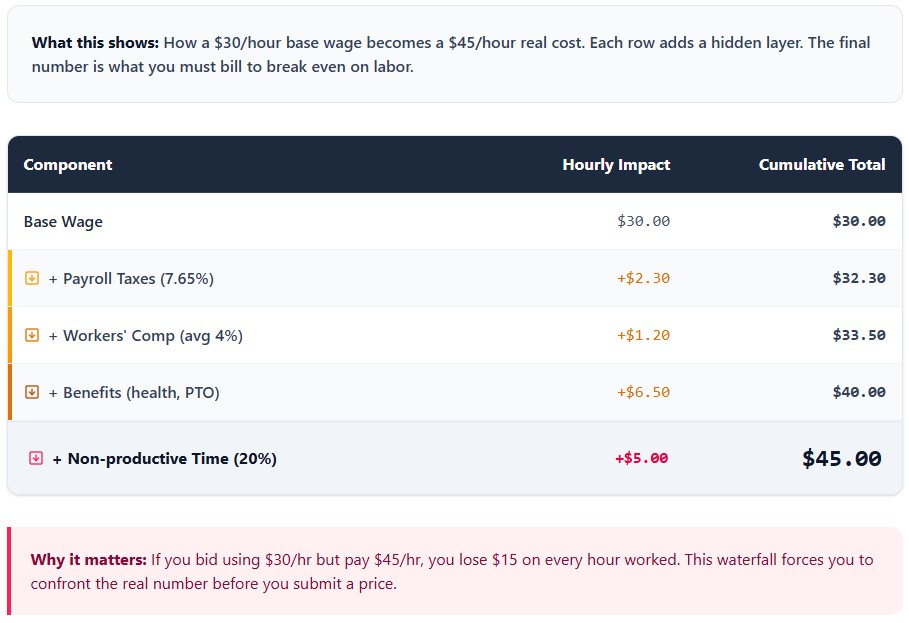
Most contractors miss non-productive time—travel, training, weather delays—which often represents 20-30% of paid hours. If you pay for 2,080 hours but only bill 1,600, that gap has to be covered by your productive rate. Use actual payroll data, not estimates, when building this calculation.
How to Calculate Break-Even Markup
Break-even Markup = Overhead ÷ Direct Costs
Required Revenue = Direct Costs ÷ (1 – Profit Margin)
Important distinction: Markup ≠ Margin. A 10% profit margin requires roughly an 11.1% markup. If your annual overhead is $150,000 and total direct costs run $500,000, you need a 30% markup just to cover overhead before profit. Many contractors apply a flat 10% across the board and wonder why margins shrink on low-labor, high-material jobs. The math doesn’t lie—test your rates against actual P&L statements.
Markup vs Profit Margin in Construction
Markup = Profit ÷ Cost
Margin = Profit ÷ Revenue
Example:
Cost = $100
Price = $120
Markup = 20% ($20 ÷ $100)
Margin = 16.7% ($20 ÷ $120)
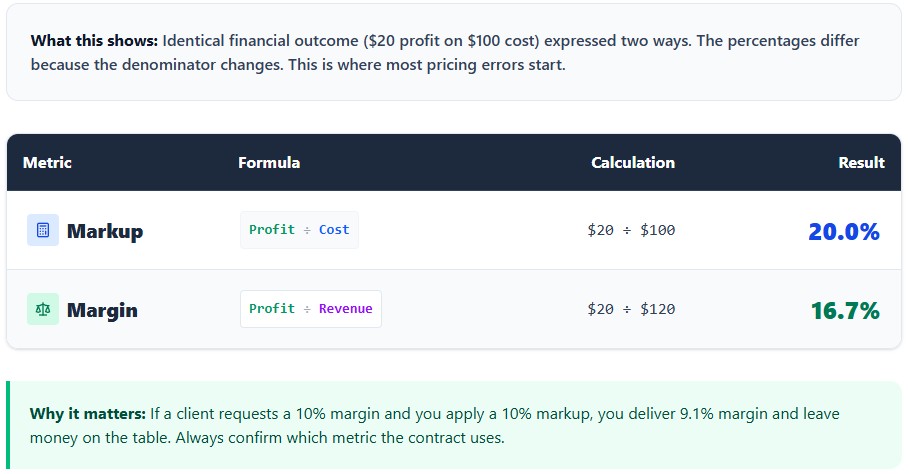
When clients ask for a 10% margin, applying a 10% markup leaves you short. This profit margin vs markup construction confusion costs contractors real money. Always clarify which metric you’re using in proposals and internal calculations.
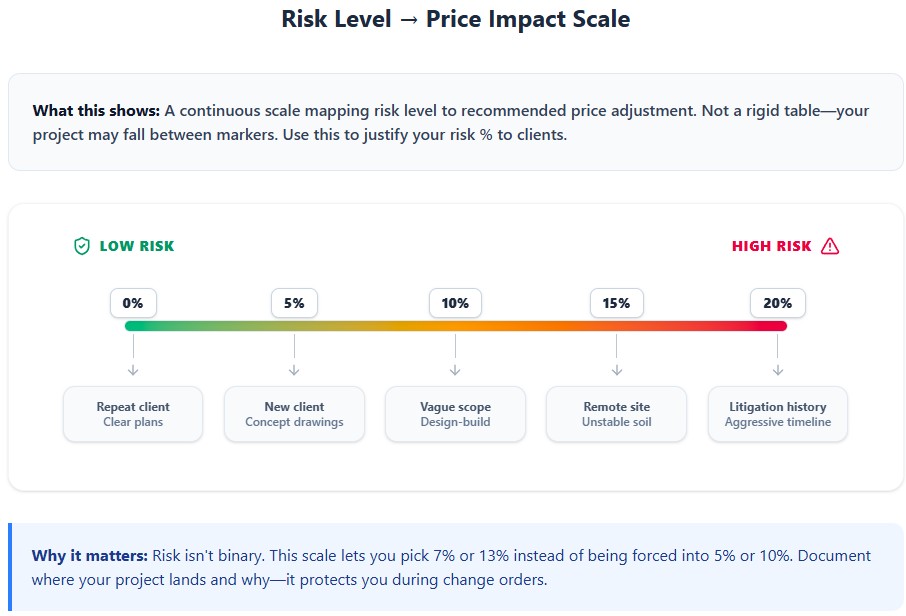
How to Add Risk to Construction Bids
Risk isn’t optional—it’s a line item. Use this guide to adjust pricing based on project variables:
| Risk Level | Adjustment Range | Typical Triggers |
|---|---|---|
| Low Risk | +0–5% | Repeat client, clear plans, indoor work, stable schedule |
| Medium Risk | +5–10% | New client, conceptual drawings, seasonal exterior work |
| High Risk | +10–20% | Vague scope, remote site, tight timeline, litigation history |
Risk Allowance = Direct Costs × Risk %
Apply this after overhead, before profit. Document your risk assessment in the proposal—it justifies pricing and sets expectations if scope changes.
Step-by-Step: How to Calculate a Construction Bid
1. Calculate direct costs (materials + labor + subs)
2. Add labor burden using your actual burden rate
3. Apply overhead % based on annual G&A divided by total direct costs
4. Add risk adjustment using the matrix above
5. Apply profit margin based on project type and strategic goals
6. Verify break-even using Required Revenue = Direct Costs ÷ (1 – Profit Margin)
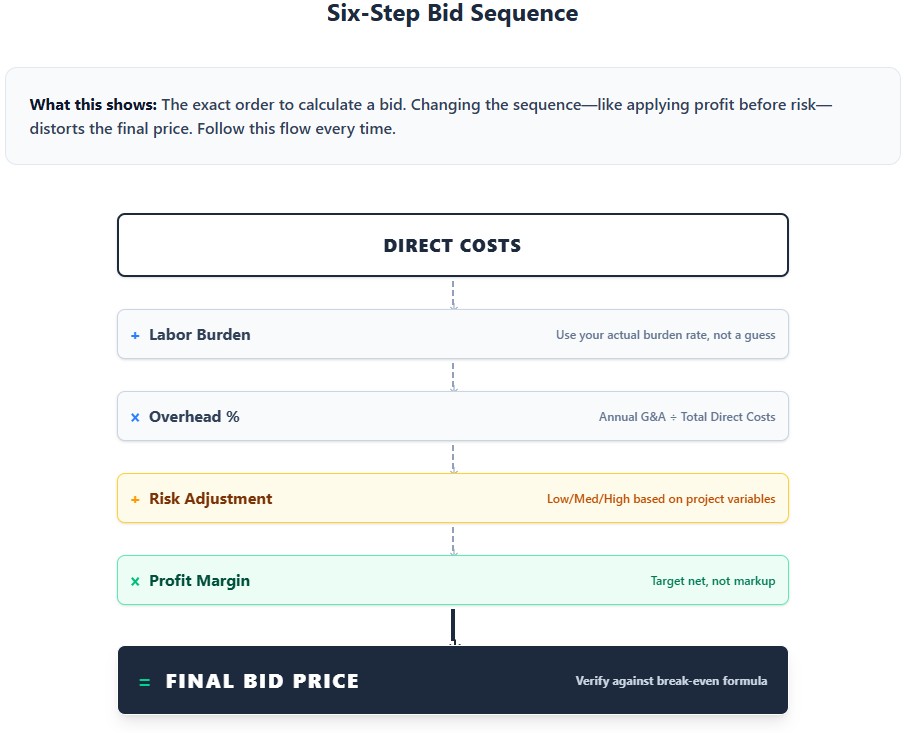
Run this sequence for every bid, even small ones. Consistency builds data you can use to refine rates over time.
Realistic Profit Benchmarks by Project Type
Industry data from the U.S. Census Bureau and NAHB shows average net profit after tax often lands between 2-5%, but disciplined firms reach 10-15% by controlling scope and pricing risk upfront. Typical targets:
Residential Remodeling: 7–12% net
Custom Home Building: 10–15%
Commercial Finish-Out: 3–7%
Civil Work: 4–8%
Source: U.S. Census Bureau Annual Survey of Construction, NAHB Housing Economics
For additional guidance on cost estimation and small business financial planning, see SBA: Calculate Your Costs. When building your next bid, focus on precision over speed. The construction bid formula works only when fed accurate inputs. Keep your overhead percentage construction rate updated, clarify profit margin vs markup construction distinctions in your team, and use a real contractor bid example as a template. That’s how you move from guessing to knowing.
Frequently Asked Questions
Recoverable (job-specific) overhead includes costs like a temporary site trailer or a project-specific permit. Non-recoverable overhead (G&A) includes company-wide costs like office rent, bookkeeper salary, and marketing budget, which must be distributed across all projects via markup.
Calculate the true burden rate by summing gross wages, payroll taxes, workers' comp, benefits, and paid non-productive time. Divide this total annual labor burden by your total annual productive hours (total paid hours minus PTO, multiplied by a productivity factor like 0.85).
A common mistake is putting all fuel and maintenance for a pickup into G&A. If it's a dedicated site truck, costs are Direct. If used for bidding and errands, it's G&A. Costs must follow the asset's primary use, and shared vehicle costs should be prorated.
Sum direct materials, burdened labor, subcontractor, and equipment costs. Add allocated G&A overhead (calculated via your overhead absorption rate). The break-even markup percentage is [(Break-Even Cost - Total Direct Costs) / Total Direct Costs] x 100.
The risk allowance should quantify project-specific risks like client payment history, site complexity, design completeness, and weather exposure. Each risk is expressed as a percentage add to the base cost, transforming uncertainty into a priced-in factor.
A flat markup treats all projects as having identical financial risk, which is incorrect. It fails to account for project-specific variables like client type, site access, and design ambiguity, which require a dynamic formula integrating a baseline cost with a variable risk premium.
Split the owner/manager salary between Direct (time spent on specific projects) and G&A (time spent on business development and administration). Failing to split means you're not funding the growth side of the business.
Benchmarks vary: Residential Remodeling (7-12%), Custom Home Building (10-15%), Commercial Tenant Finish-Out (3-7%), Civil/Infrastructure (4-8%). Top performers exceed averages by mastering scope definition and risk transfer.
Non-productive labor includes paid time for training, travel, tool maintenance, and clean-up. Its cost must be spread across productive billable hours. If a worker is paid for 2,080 hours but only bills 1,600, the cost of the 480 non-productive hours increases the burden on the productive ones.
A dynamic bid recap template uses formulas to automatically cascade cost changes through the entire bid. It ensures overhead recovery and risk allowances are tracked, allows for scenario modeling, and serves as a post-mortem tool to compare estimates against actuals, improving future accuracy.
Software subscription costs should be prorated. A portion is G&A for admin use, but a per-project license or user fee may be a Direct, recoverable cost. This allows you to bill software costs directly to larger projects, improving bid accuracy.
Final Bid Price = (Direct Materials + Direct Labor + Subcontractor Costs) x (1 + Burden Rate) x (1 + Base Profit Margin %) + (Quantified Risk Allowance). The risk allowance is a calculated premium based on project-specific factors like client history and site complexity.