First, the Basics: What Gross Margin Actually Measures
Gross profit margin tells you how much of each revenue dollar stays with you after paying direct costs to deliver your product or service.
Formula:
Gross Margin % = (Revenue – COGS) ÷ Revenue × 100
What counts as COGS (per IRS Pub 535 and IRC §471):
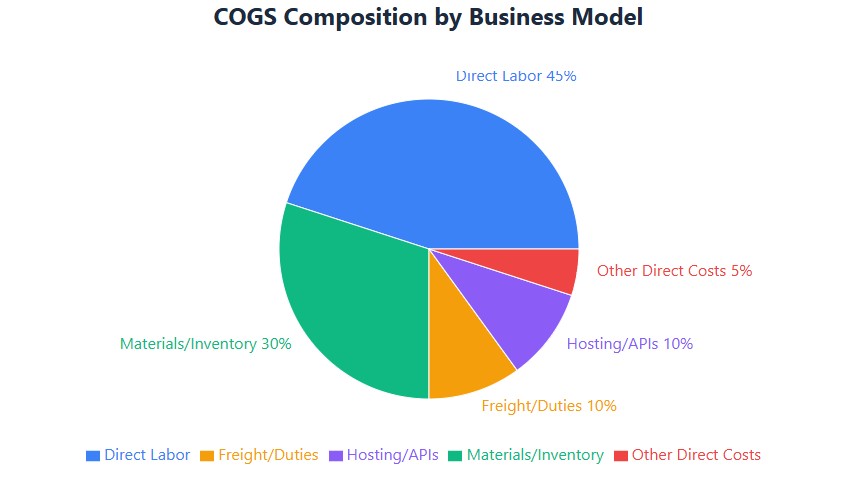
- Raw materials or inventory purchased for resale
- Direct labor: wages for employees who physically create or deliver the product (e.g., installers, factory workers, developers on client projects)
- Freight-in, duties, and packaging directly tied to delivery
- Usage-based third-party costs essential to fulfillment (e.g., API calls, payment processing fees for digital products)
What does NOT count as COGS:
- Sales, marketing, or advertising spend
- Admin salaries, rent, utilities, or general overhead
- Owner draws or officer compensation (unless direct labor, properly documented)
- Software subscriptions not directly tied to delivery
Source: IRS Pub. 535, Chapter 8; IRS Pub. 538 (Accounting Methods)
2026 Gross Margin Benchmarks by Industry (US Small Business)
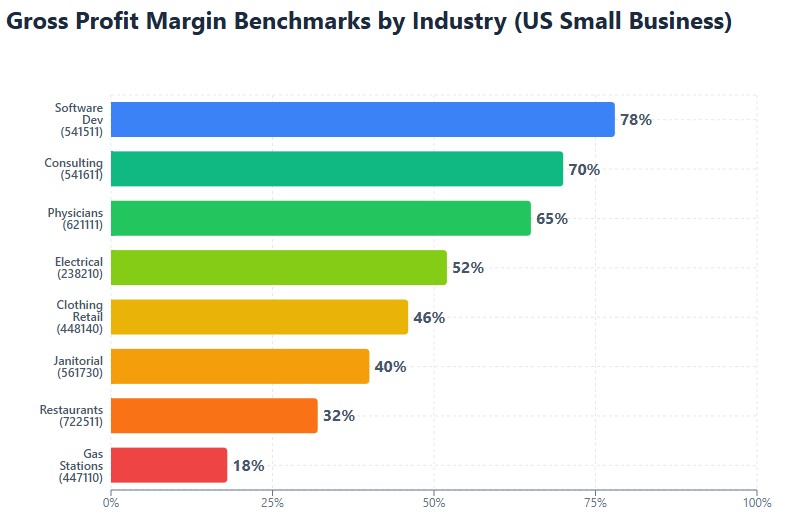
These medians reflect actual performance from private US small businesses ($1M–$10M revenue), sourced from RMA Annual Statement Studies, Dun & Bradstreet NAICS reports, SBA sector summaries, and NRF retail data—updated for 2026 inflation, wage trends, and supply chain conditions.
| Industry (NAICS Code) | 2026 Median Gross Margin | Typical COGS Drivers | Key Risk to Watch |
|---|---|---|---|
| 541511 – Custom Software Development (RMA, SBA) |
78% | Developer time (client projects), cloud hosting (customer-facing), third-party APIs | Misclassifying R&D labor as COGS; amortization rules under IRC §174 |
| 448140 – Clothing Retail (NRF, D&B) |
46% | Inventory cost, freight-in, shrinkage, payment processing | Inventory valuation method (FIFO/LIFO); markdown timing |
| 561730 – Janitorial Services (SBA, D&B) |
40% | Direct labor (cleaners), supplies, equipment maintenance | 1099 vs. W-2 classification; state labor law compliance |
| 238210 – Electrical Contractors (RMA, SBA) |
52% | Materials, direct labor (electricians), vehicle costs for job sites | Allocating labor to projects; change-order documentation |
| 722511 – Full-Service Restaurants (NRF, D&B) |
32% | Food cost, beverage cost, direct kitchen labor | Food waste tracking; tip credit accounting |
| 541611 – Administrative Management Consulting (RMA) |
70% | Consultant time (client-billable), travel directly tied to delivery | Time tracking rigor; distinguishing billable vs. non-billable hours |
| 447110 – Gasoline Stations (D&B, SBA) |
18% | Fuel inventory, credit card fees, environmental compliance costs | Fuel price volatility; inventory accounting method |
| 621111 – Offices of Physicians (SBA, MGMA) |
65% | Medical supplies, direct clinical staff, lab fees | Insurance reimbursement timing; supply cost allocation |
How to Calculate and Benchmark Your Margin (Step by Step)
- Pull your numbers: Get year-to-date 2026 revenue and COGS from your Schedule C, Form 1120/1120-S, or accounting software (QuickBooks, Xero). Ensure COGS includes only direct costs per the definition above.
- Calculate your margin: Use the formula: (Revenue – COGS) ÷ Revenue. Example: $200,000 revenue – $104,000 COGS = $96,000 gross profit → 48% margin.
- Find your NAICS code: Use the SBA’s Size Standards Tool or the NAICS Association lookup. Misclassification skews benchmarking.
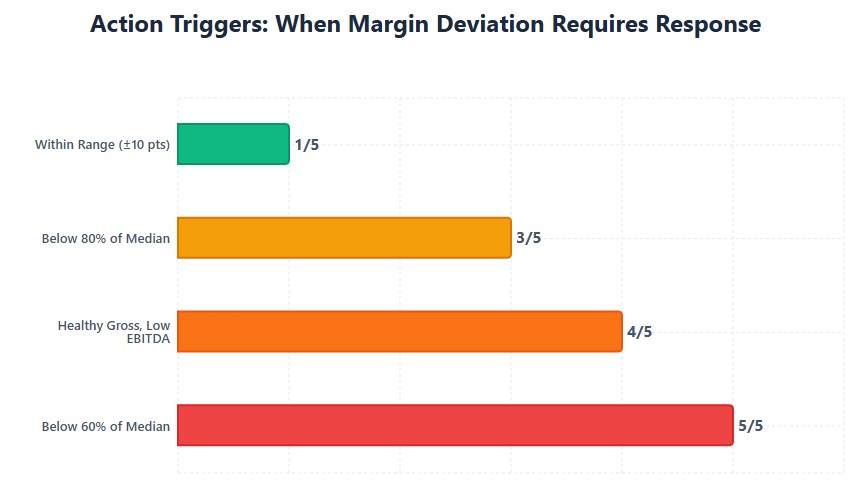
- Compare to the median: If your margin is within ±10 percentage points of the 2026 median for your NAICS code, you’re in the typical range. More than 15 points below? Investigate.
- Adjust for your model: Service firms often have higher margins than retailers. If you’re a hybrid (e.g., SaaS + services), benchmark each segment separately.
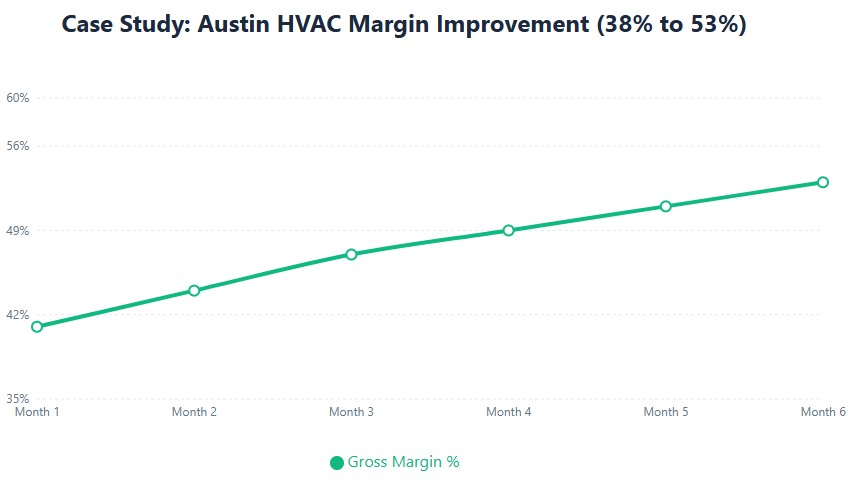
Real example: An Austin-based HVAC contractor saw refrigerant costs jump 38% in early 2026. Instead of absorbing the hit, they restructured service packages into tiered bundles (basic/premium/platinum), shifting from hourly billing to value-based pricing. Result: gross margin rose from 41% to 53% in six months—with no client loss.
Service vs. Retail: Why Margins Work Differently
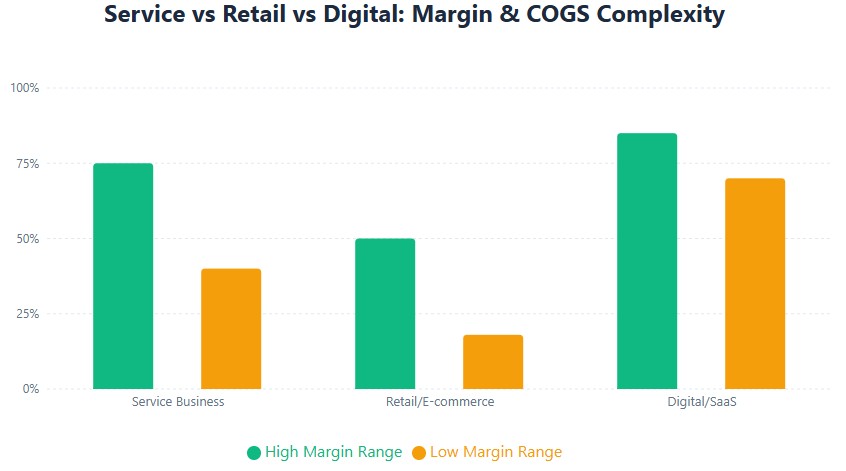
Not all margins are created equal. A 40% margin might be strong for a retailer but weak for a consultant. Here’s the breakdown:
Service Businesses (Consulting, Marketing, Trades)
- Typical margin range: 40–75%
- COGS is lean: Mostly direct labor and job-specific materials
- Biggest lever: Pricing strategy and utilization rate (billable hours)
- Watch out for: Misclassifying subcontractor payments. Only 1099-NEC costs directly tied to client deliverables count as COGS—and only with time-tracking documentation.
Retail & E-commerce
- Typical margin range: 18–50%
- COGS is complex: Inventory, freight-in, duties, shrinkage, payment fees
- Biggest lever: Inventory turnover and vendor negotiation
- Watch out for: Inventory valuation method (FIFO vs. LIFO). Changing methods requires IRS Form 3115—and affects margin comparability year over year.
Digital Products & SaaS
- Typical margin range: 70–85%
- COGS is minimal but specific: Hosting (customer-facing), payment processing, usage-based APIs, amortized development costs
- Biggest lever: Pricing tiers and churn reduction
- Watch out for: IRC §174 capitalization rules for software development. Developer wages aren’t expensed as COGS—they’re capitalized and amortized.
When Your Margin Triggers Action (Not Panic)
Your margin is a leading indicator. When it drifts from benchmarks, respond early—not reactively. These thresholds are based on 2026 lending patterns, compliance trends, and investor expectations.
- If your margin is <80% of the RMA median for your NAICS code: Conduct a COGS audit. Many businesses underclaim freight-in, direct materials, or job-specific labor. Use IRS Pub. 535 as your checklist.
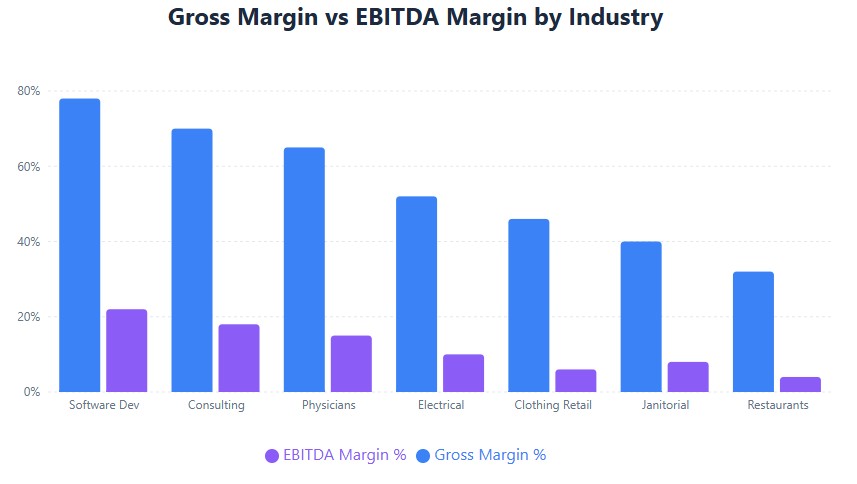
- If gross margin is healthy but EBITDA is <5%: Investigate operating overhead. High payroll taxes, rent burden, or underutilized staff can kill cash flow even with strong unit economics.
- If you’re preparing for an investor raise: Aim for gross margins within typical venture benchmarks: 75–80% for SaaS, 45–50% for DTC e-commerce. Falling below isn’t disqualifying—but be ready to explain why.
- If expanding to a new state: Run a nexus check via the Streamlined Sales Tax Governing Board before finalizing pricing. A 5-point margin boost means nothing if you trigger retroactive tax liabilities.
Compliance Notes: What the IRS and States Actually Watch
Your gross margin isn’t directly “flagged” by the IRS—but inconsistencies can raise questions during an audit. Here’s what actually matters:
- Documentation over thresholds: The IRS Audit Technique Guide for Small Business focuses on whether COGS is substantiated—not whether your margin matches a benchmark. Keep vendor invoices, inventory counts, and labor allocation logs.
- Consistency matters more than perfection: Changing your COGS calculation method (e.g., inventory valuation, labor allocation) without filing Form 3115 can make your margin trends non-comparable—and raise red flags during SBA loan reviews.
- State rules add nuance: Washington’s B&O tax applies to gross receipts, not net income—so margin accuracy affects compliance. Texas franchise tax uses a margin-based calculation. In both cases, misclassifying COGS can trigger penalties.
- Contractor classification: Misclassifying W-2 employees as 1099 contractors to inflate margins is a high-risk audit trigger. Use IRS Form SS-8 criteria to verify independent status—and document time allocation if subcontractor costs are in COGS.
Source: Form 3115 Instructions
Quick Answers to Founder Questions
Does gross margin include payroll?
Only direct labor—employees who physically create or deliver your product (e.g., welders, installers, developers on client work). Admin, sales, and owner salaries are operating expenses, not COGS. Service firms using IRC §263A must track time and allocate labor carefully.
Can I use cash accounting for margin reporting?
Yes, if your average annual gross receipts over the prior three years are under $26 million (TCJA small business exception). Most sole props and LLCs qualify. Cash basis simplifies COGS tracking—but be consistent year over year.
Where can I find free 2026 industry benchmarks?
Start with the SBA’s sector reports and the NAICS Association public lookup.
What if my margin is below benchmark but my business is profitable?
Benchmarks are guides, not rules. If your model is different (e.g., premium pricing with higher COGS, or a loss-leader strategy), document the rationale. Consistency and justification matter more than matching the median.
Next Steps: Turn Data into Action
- Calculate your 2026 YTD gross margin using the formula above. If you haven’t reviewed COGS definitions this year, do it now.
- Compare to the median for your NAICS code using the table or RMA/SBA sources. Note any gap >10 points.
- Document your COGS methodology in a simple memo: what you include, what you exclude, and why. This is your audit defense.
- Review pricing quarterly if input costs are volatile (e.g., materials, freight, contractor rates). Small adjustments compound.
- Consult a CPA if you’re near a threshold (e.g., $26M revenue for accounting method eligibility) or operating in multiple states.
One Last Thing
Gross margin isn’t about hitting a number. It’s about understanding your unit economics well enough to make smart decisions—on pricing, hiring, expansion, and risk.
Track it. Benchmark it. But don’t let a median dictate your strategy. Your business is unique. Your margin should reflect that—with clarity, consistency, and documentation to back it up.