If you look at the macro numbers from the U.S. Geological Survey (USGS) or the Portland Cement Association (PCA), the cement industry looks like a cash machine. Demand is driven by massive infrastructure spending, and top-line revenues are high. But if you talk to anyone running a regional distribution outfit or a mid-sized kiln, they’ll tell you a completely different story.
The reality of the cement business in 2026 is that nobody wins on “volume alone” anymore. Margins are being squeezed by a brutal combination of localized logistics, shifting carbon regulations, and volatile fuel contracts. Here’s the actual math—the kind you won’t find in investor presentations.
Cement Price Trends: Five Years of Data + 2027 Forecast
U.S. cement prices have climbed 80% since 2020, but production costs have risen faster in many regions. The gap between sticker price and actual margin tells the real story. Global production reached 4.57 billion metric tons in 2026, according to USGS Mineral Commodity Summaries, with U.S. output accounting for approximately 2% of global capacity.
| Year | Avg. Price (USD/MT) | YoY Change | Production Cost/MT | Net Margin % | Key Driver |
|---|---|---|---|---|---|
| 2020 | $92 | — | $78 | 15.2% | Pre-pandemic baseline |
| 2021 | $98 | +6.5% | $84 | 14.3% | Post-COVID recovery |
| 2022 | $125 | +27.6% | $108 | 13.6% | Energy crisis, supply chain |
| 2023 | $145 | +16.0% | $122 | 15.9% | Infrastructure bill demand |
| 2024 | $160 | +10.3% | $138 | 13.8% | Peak energy costs |
| 2025 | $163 | +1.9% | $142 | 12.9% | Market stabilization |
| 2026 (Est.) | $165 | +1.2% | $147 | 11.0% | Moderate growth, margin compression |
| 2027 (Proj.) | $172–178 | +4–8% | $152–158 | 10–13% | Carbon compliance costs, selective demand |
Sources: USGS Mineral Commodity Summaries 2026, PCA Economic Report, IBISWorld Cement Manufacturing, IMARC Group Cement Pricing Index, BloombergNEF Carbon Forecast
Key insight: Net margins have compressed from 15.2% (2020) to an estimated 11.0% (2026) despite 80% price growth—proof that cost inflation is outpacing pricing power in most regions.
True Cost Breakdown: What It Actually Costs to Make a Ton of Cement
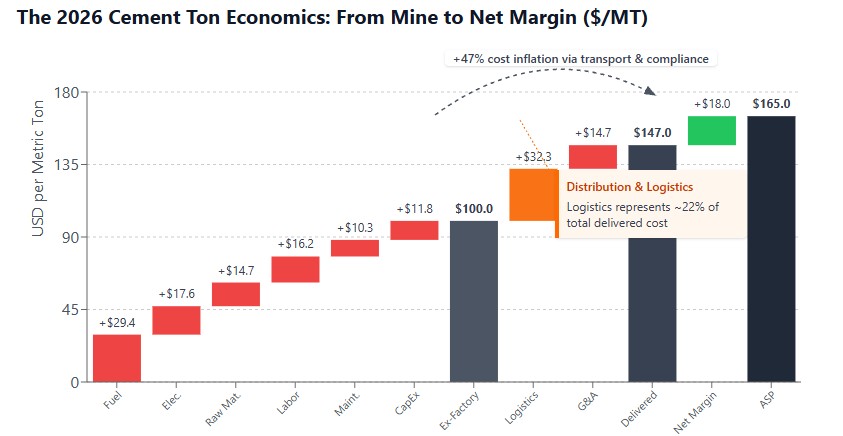
Every metric ton of Portland cement costs approximately $147 to produce and deliver before G&A and taxes. But the headline number hides the real story. Here’s where every dollar goes—including the costs most operators won’t admit to:
| Component | Cost per Ton | % of Total | 2026 Reality Check |
|---|---|---|---|
| Fuel & Thermal Energy | $29.40 | 20.0% | Natural gas $3.50–4.50/mmBtu; coal $85–110/ton. Plants with hedged 2023–2024 contracts save $8–14/ton vs. spot buyers. According to U.S. Energy Information Administration (EIA) forecasts, natural gas volatility may reach $5.50/mmBtu in 2027. |
| Electrical Energy | $17.64 | 12.0% | Industrial rates $0.08–0.14/kWh by region. PPA (Power Purchase Agreements) for renewables can lock in $0.06–0.08/kWh, saving $3–5/ton. |
| Raw Materials & SCMs | $14.70 | 10.0% | Limestone, clay, iron ore; quarry depletion adds $0.50–1.50/ton. Fly ash and GBFS (slag) shortages pushing SCM costs up 15–20%. |
| Labor & Overhead | $16.17 | 11.0% | Plant operators $32–45/hr; skilled technician shortage driving 5–8% wage inflation YoY. |
| Maintenance & Spares | $10.29 | 7.0% | Refractory replacement every 3–5 years ($2–5M/kiln). Roller mill rebuilds every 7–10 years ($1–3M). |
| Sustaining CapEx | $11.76 | 8.0% | Hidden cost: Annual capex to maintain existing capacity (filters, kiln shells, environmental upgrades). Often excluded from “cash cost” metrics but critical for long-term viability. |
| Distribution & Freight | $32.34 | 22.0% | Rail $0.08–0.12/ton-mile; truck $0.18–0.24/ton-mile. Terminal handling adds $4–7/ton. Last-mile trucking beyond 150 miles kills margins. |
| G&A, Permits & Carbon Compliance | $14.70 | 10.0% | Insurance, permits, environmental compliance (CARB adds $6–9/ton in CA, RGGI $3–5/ton in Northeast). |
Total production + logistics cost: $147/MT | Average selling price: $165/MT | Gross margin before tax: $18/MT (12.2%)
 Sources: CemBureau Cost Benchmark, iFactory Cement, EIA Industrial Energy Prices, PCA Maintenance Survey 2025
Energy Efficiency: The Hidden Margin Driver
Not all tons are created equal. A modern dry-process kiln with preheater/precalciner runs at 3.0–3.4 GJ/ton of clinker, while older wet-process kilns burn 4.5–5.5 GJ/ton. That’s a $6–10/ton cost disadvantage for legacy plants.
Electrical intensity: State-of-the-art plants use 90–110 kWh/ton of cement; outdated facilities burn 130–160 kWh/ton. At $0.10/kWh, that’s another $4–6/ton gap.
Real-world impact: A 500,000-ton/year plant with inefficient kilns loses $3–5M annually vs. a modern competitor—before accounting for carbon costs. Cement production generates approximately 0.6–0.8 tons of CO₂ per ton of cement, according to CEMBUREAU, making carbon pricing a critical margin factor.
Regional Margins: Where the Business Actually Works
Geography is destiny in cement. A ton produced in Texas nets 20%+; the same ton in California clears under 17% after compliance costs. But the real story is in contract structures and cost pass-through.
| State/Region | Avg. Price/MT | Production Cost/MT | Net Margin | Annual Production (MT) | Key Factor |
|---|---|---|---|---|---|
| Texas | $148 | $118 | 20.3% | 18.5M | Local limestone, Class I rail access, no state carbon tax |
| Missouri | $142 | $112 | 21.1% | 6.2M | Mississippi River barges ($0.05/ton-mile), low energy costs |
| Indiana | $145 | $115 | 20.7% | 5.8M | Great Lakes shipping, limestone-rich corridors |
| Ohio | $152 | $122 | 19.7% | 4.9M | Appalachian coal access, moderate logistics |
| Florida | $168 | $138 | 17.9% | 2.1M (plus 8M imports) | Import clinker from Turkey/Vietnam, port fees add $8–12/ton |
| California | $195 | $162 | 16.9% | 9.8M | CARB compliance ($6–9/ton), highest labor costs ($38–52/hr) |
| New York | $188 | $158 | 16.0% | 1.8M (plus 5M imports) | High delivery costs, RGGI carbon pricing ($3–5/ton) |
| Pennsylvania | $165 | $135 | 18.2% | 3.4M | Moderate logistics, legacy quarry access |
Sources: PCA Regional Statistics, USGS State-Level Data, IBISWorld, Company Earnings Calls
Contract reality: 60–70% of cement volumes move on annual fixed-price contracts with large ready-mix networks and infrastructure developers. These contracts typically include 10–15% discounts off spot prices but provide volume certainty. The remaining 30–40% sells at spot (100% of list price) to smaller contractors.
Cost pass-through efficiency: Producers in capacity-constrained markets (TX, FL) can pass through 85–95% of cost inflation to customers. In saturated markets (Northeast, parts of Midwest), producers absorb 35–45% of cost increases, compressing margins.
The 150-Mile Wall + Terminal Economics
Cement is heavy, cheap to make at the source, and incredibly expensive to move. The golden rule of domestic cement economics is the 150-mile freight radius for trucking. Beyond that, rail or barge is mandatory.
- Rail/Barge: $0.05–0.12/ton-mile (economical up to 500+ miles)
- Truck: $0.18–0.24/ton-mile (breaks margins beyond 150 miles)
- Terminal handling: $4–7/ton (unloading, storage, reload to truck)
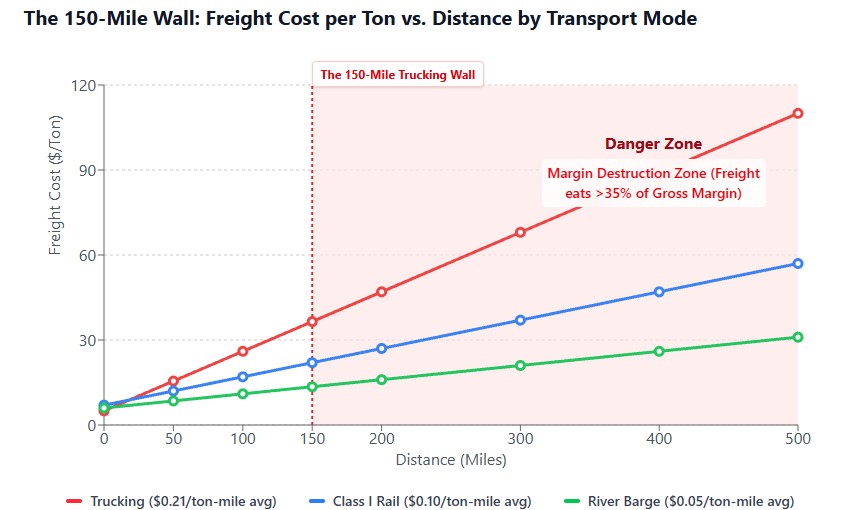
Real math: If a distributor hauls Type I/II Portland cement 180 miles via truck because a local terminal is dry, freight alone eats 35% of gross margin. That’s why Mid-West operators with Mississippi River barge access (MO, IL) or Great Lakes shipping (IN, OH) maintain 20%+ net margins while coastal players scrape by at 16–17%.
Terminal ownership: Companies that own their distribution terminals (vs. third-party logistics) save $2–4/ton and control delivery schedules. But terminal CapEx runs $10–20M for a 100k-ton/year facility—payback period 5–7 years.
B2B Unit Economics & Logistics Calculator
Model freight lanes, PLC clinker substitution, and their combined impact on net margin per ton — based on the 150-mile trucking wall and cost benchmarks covered in the article.
Shipment & Route
Mix Design & Pricing
Import Parity Pricing: The Coastal Ceiling
Coastal markets (FL, CA, NY, NJ) face constant pressure from imports. Here’s the full landed cost chain:
| Cost Component | Cost per Ton | Notes |
|---|---|---|
| Cement (CIF U.S. port) | $53–70 | Turkey, Vietnam, Thailand |
| Port handling & storage | $12–18 | Stevedoring, bagging, warehouse fees |
| Trucking from port (50–150 miles) | $15–25 | Depends on distance and fuel prices |
| Total Landed Cost | $80–113 | At customer site (vs. domestic $145–195/ton) |
Anti-dumping duties: 25–50% on some origins (Turkey, Vietnam), but even with tariffs, imported cement can undercut domestic production in coastal markets by $15–25/ton.
Trend: U.S. cement imports averaged 8–12 million metric tons annually (2023–2025), flat YoY due to shipping costs and duties. Domestic production forecast to rise only 0.6% (IBISWorld).
The Clinker Factor + SCM Shortages
Making traditional clinker—the core ingredient in cement—requires blasting rotary kilns with massive amounts of energy (primarily natural gas or coal) to hit 2,700°F. With industrial natural gas prices seeing unpredictable regional swings across U.S. pipelines, thermal efficiency is everything.
The winners are aggressively pushing Type IL Portland Limestone Cement (PLC), which allows for up to 15% raw limestone substitution instead of pure clinker (per ASTM C595).
- Every 1% reduction in the clinker-to-cement ratio yields a direct 0.8% to 1.2% reduction in fuel costs.
- Companies leveraging alternative waste-derived fuels (like processed scrap tires or municipal waste solids) are shaving up to 18% off their thermal energy bills compared to plants relying strictly on spot-market natural gas.
Important: Not all state DOTs allow the full 15% limestone substitution. Some (like California DOT) limit to 5–8% for certain applications, reducing the margin benefit.
State DOT Approvals: The Hidden Gatekeeper of Cement Margins
Real cement operators know that production margins mean nothing if your product isn’t approved by the state Department of Transportation (DOT) for highway and infrastructure projects. DOT specifications control 30–40% of total cement demand in most states, and approval timelines can make or break a producer’s ability to monetize low-clinker blends.
Fast-Approval States (Texas, Missouri, Indiana): TxDOT and MoDOT have streamlined PLC (Type IL) approval processes, typically certifying new blends within 60–90 days. This allows producers to quickly pivot to 15% limestone substitution and capture the full $8–14/ton fuel cost savings. Texas DOT’s Item 421 (Cement) explicitly permits Type IL with up to 15% limestone, aligning with ASTM C595.
Conservative States (California, New York, Pennsylvania): Caltrans, NYSDOT, and PennDOT maintain more restrictive specifications, often limiting limestone content to 5–8% for structural concrete and pavement applications. Approval cycles stretch to 12–18 months, requiring extensive field testing and third-party validation. During this waiting period, producers must stockpile non-compliant inventory or sell at commodity prices to non-DOT customers, burning 10–15% of potential margin.
Strategic implication: A 500,000-ton plant in Texas can realize $4–7M annual savings from PLC adoption within one year. The same plant in California may wait 18 months for DOT approval, during which time it operates at a $6–10/ton cost disadvantage versus approved competitors. This regulatory lag is a hidden margin killer that investor presentations rarely disclose.
Source: State DOT Specifications (TxDOT Item 421, Caltrans Section 90, NYSDOT Standard Specifications), PCA Government Relations Report 2026
SCM Crisis: Fly Ash and Slag Shortages
The bigger story for future is the structural shortage of supplementary cementitious materials (SCMs):
- Fly ash (from coal power plants): U.S. coal generation down 40% since 2015. Fly ash supply shrinking 5–7% annually. Prices up 25–30% in 2025–2026.
- Ground granulated blast furnace slag (GBFS): Steel mini-mills (electric arc) don’t produce slag; only integrated blast furnaces do. U.S. integrated steel capacity down 15% since 2020. GBFS imports from China/India up 40%, but shipping costs add $20–30/ton.
The replacement play: Calcined clay (metakaolin) is emerging as the alternative. Requires a calciner ($30–50M CapEx for 100k ton/year), but:
- Reduces CO₂ by 35–45% vs. traditional clinker
- Qualifies for IRA Section 45Q credits ($60–85/ton CO₂ stored)
- Commands a “green cement” premium of $15–30/ton in CA, NY, MA
The Regulatory Delta: Section 45Q and the CCUS Reality Check
You cannot analyze U.S. industrial financials without looking at the compliance balance sheet. The divide between states under strict regional frameworks (like California’s CARB or the Northeast’s RGGI) and unregulated corridors is widening.
- High-regulation markets (CA, NY, MA): Compliance costs add $6–9/ton operational overhead.
- Unregulated corridors (TX, MO, IN): No carbon pricing, lower environmental permitting costs.
Section 45Q Tax Credits (Inflation Reduction Act):
- $85/MT for secure geological storage of CO₂
- $60/MT for utilization (EOR, concrete curing)
- Qualification: Requires direct air capture or point-source capture with third-party verification
The CCUS math nobody talks about: Capturing 1 ton of CO₂ from a cement kiln costs $90–130/ton (OpEx + CapEx amortized). Even with the full $85/ton 45Q credit, you’re still $5–45/ton underwater unless you:
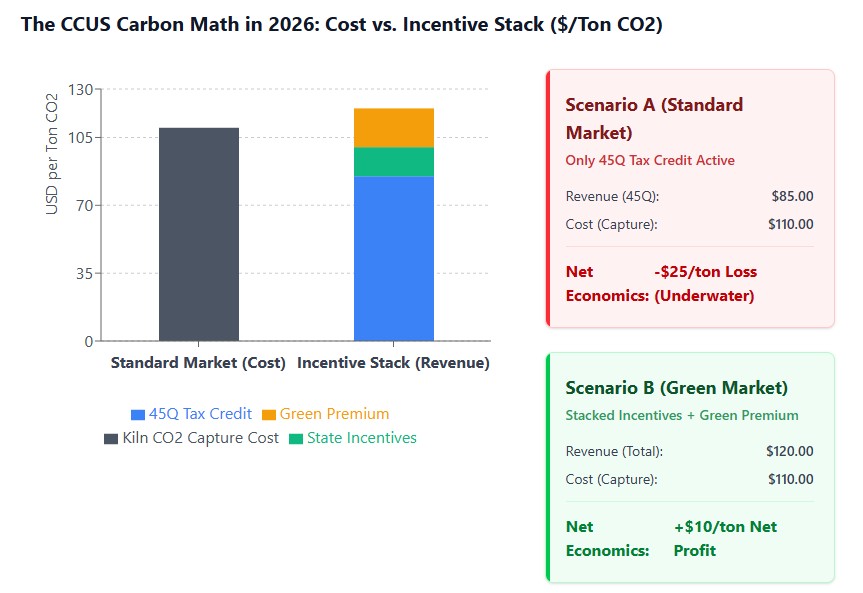
- Sell “green cement” at a $15–30/ton premium (possible in CA, NY, MA)
- Stack 45Q with state-level incentives (e.g., California LCFS credits)
- Use low-cost capture tech (amine scrubbing on high-CO₂ flue gas)
Real impact: For a facility moving 400,000 tons of output annually, factoring in carbon capture credits can alter net margins by 4 to 6 percentage points—but only if capture costs are below $100/ton and premiums are locked in.
Business Model Margins + M&A Multiples
| Business Model | Revenue/Year | EBITDA Margin | Net Margin | EV/EBITDA | EV/Ton Capacity |
|---|---|---|---|---|---|
| Vertically Integrated Tier-1 (Holcim, Cemex, Buzzi) |
$500M–$2B+ | 22–28% | 16–22% | 7–9x | $130–180/ton |
| Independent Regional Distributor (Industrial Bulk) |
$50M–$200M | 12–16% | 5–9% | 4–6x | $90–130/ton |
| Specialty Blends / Low-Carbon (PLC, API oil well cement) |
$30M–$150M | 28–35% | 18–24% | 8–11x | $150–200/ton |
| Ready-Mix Concrete (Downstream) | $20M–$100M | 14–18% | 8–12% | 5–7x | N/A |
Sources: PCA Industry Statistics, IBISWorld Cement Manufacturing Report 2026, Company 10-K filings, Bloomberg M&A Database
Downstream Integration: The Ready-Mix Concrete Connection
Cement does not exist in isolation—approximately 60–70% of U.S. cement production flows directly into ready-mix concrete plants owned by the same producers (Holcim, Cemex, Buzzi, Heidelberg Materials). This vertical integration is the single biggest determinant of sustained profitability in the cement value chain.
Margin dynamics: While cement production nets 11–20% depending on region, ready-mix concrete typically operates at 8–12% net margins. However, ready-mix provides stable, captive demand that insulates producers from spot market volatility. A fully integrated producer (quarry → cement → ready-mix) can achieve blended net margins of 14–18%, versus 11–13% for standalone cement operators.
2026 pressure points: Ready-mix margins are under squeeze from three directions: (1) aggregate shortages (crushed stone up 20–25% since 2020), (2) driver shortages for concrete trucks (CDL wages up 12–15% YoY), and (3) project delays from permitting bottlenecks. When ready-mix margins compress below 8%, integrated producers face a choice: absorb the loss (protecting cement volume) or raise concrete prices (risking volume loss to independents).
Strategic takeaway: Investors evaluating cement assets must analyze the ready-mix attachment rate. A cement plant with 40–60% captive ready-mix offtake is significantly less risky than a merchant plant selling 100% to third parties. This is why Tier-1 players continue acquiring regional ready-mix operators even at 5–7x EBITDA multiples—securing downstream demand is as critical as controlling upstream limestone reserves.
Source: NRMCA (National Ready Mixed Concrete Association) Industry Statistics 2026, Company 10-K Filings, IBISWorld Concrete Manufacturing Report
M&A insight: Buying existing capacity at $130–180/ton is 30–50% cheaper than greenfield construction ($250–350/ton with environmental permitting). That’s why the market is consolidating: Holcim, Cemex, Heidelberg, Buzzi, and CRH now control >65% of U.S. capacity (CR4 ≈ 0.65, HHI ≈ 1,400—moderately concentrated).
Pricing power: In states where top-3 players control >70% of capacity (CA, FL, parts of Northeast), list prices are 15–20% above competitive markets (TX, MO). Antitrust scrutiny is increasing, but local monopolies persist.
CapEx Reality: Greenfield vs. Brownfield vs. M&A
Unlike a software startup, you cannot pivot easily when $200,000 is bolted down into a concrete floor with specialized plumbing and venting requirements. Cement is capital-intensive:
- Greenfield kiln construction: $250–350 per ton of annual capacity (a 500k ton/year plant = $125–175M CapEx, plus 3–5 years for permitting)
- Brownfield expansion (debottlenecking): $120–180/ton (faster, but limited by existing infrastructure)
- Sustaining CapEx: $8–15/ton annually (replacement of refractory, kiln shells, baghouse filters, environmental upgrades)
- Refractory replacement: Every 3–5 years, $2–5M per kiln (downtime = 10–15 days, lost production = 15–25k tons)
- Roller mill rebuild: Every 7–10 years, $1–3M
- Annual maintenance budget: 3–5% of revenue (vs. 1–2% for lighter manufacturing)
Depreciation impact: A $150M plant depreciated over 25 years = $6M/year non-cash expense, reducing taxable income but masking true cash flow. Free cash flow (FCF) is typically 40–60% of net income after sustaining CapEx.
The Actionable Takeaway for Operators
If you are looking to protect or evaluate margins in today’s landscape, look past the overall production volume. Focus heavily on these operational metrics:
- Captive Output Percentage: What percentage of the cement goes directly into owned or contractually locked ready-mix concrete plants? (Higher is safer—40–60% is ideal)
- The Intermodal Ratio: What percentage of total inbound raw materials and outbound finished products moves via rail or water vs. long-haul trucking? (Target 70%+ rail/barge)
- The Blended Ratio: What is the operational pivot speed toward low-clinker formulations (PLC) to mitigate thermal fuel exposure? (Every 1% clinker reduction = 0.8–1.2% fuel savings)
- Specific Energy Consumption: How many GJ/ton of clinker and kWh/ton of cement does your plant use? (Benchmark: <3.2 GJ/t clinker, <110 kWh/t cement for modern dry kilns)
- Hedged Energy %: What percentage of your gas and power is under fixed-price contracts or PPAs? (Target 60–80% hedged to avoid spot volatility)
- SCM Substitution Rate: What % of fly ash/slag can you replace with calcined clay or limestone? (Fly ash shortages will worsen through 2027)
Bottom Line
The cement business rewards operators who control three things: logistics (rail/barge access, terminal ownership), energy (low-clinker blends, alternative fuels, hedged contracts), and regulatory positioning (Section 45Q credits, low-carbon state incentives, SCM substitution). Volume won’t save a business with bad geography and exposed energy contracts. The margins belong strictly to those who control the logistics chain from the quarry floor directly to the job site transit mixer.
For investors: Mid-West producers (TX, MO, IN, OH) with 20%+ net margins, 70%+ rail/barge mix, and >60% hedged energy are structurally advantaged over coastal players. M&A multiples (7–9x EBITDA for Tier-1, $130–180/ton capacity) suggest limited downside for quality assets, but regulatory risk (carbon pricing, antitrust) is rising.
For buyers: Sourcing from Mid-West mills saves $18–24/ton vs. coastal production. Lock in annual contracts (10–15% discount) where possible, but verify cost pass-through clauses—2026–2027 will see continued margin compression in saturated markets.
2027 outlook: Prices expected to rise 4–8% ($172–178/ton avg), but production costs will climb 3–6% ($152–158/ton) due to carbon compliance, labor inflation, and SCM shortages. Net margins likely to compress another 1–2 percentage points in coastal markets, stable in Mid-West. Watch for M&A acceleration as smaller players exit.