
The Bootstrapper’s Survival Triad: A New Framework for Cash Sustainability
Most financial advice for startups is written for venture-backed founders. They talk about “extending runway” by raising a bridge round or optimizing burn to hit the next valuation milestone. But if you are bootstrapping, you do not have a board of directors to bail you out, and you cannot issue shares to cover a payroll shortfall.
For self-funded founders, standard startup metrics are incomplete. They only look at the corporate bank account. But a business does not operate in a vacuum; it operates on the financial and psychological endurance of its founder.
Here is the central thesis of bootstrapped cash sustainability: True runway is not just the cash in your business account. It is the exact date when your business capital, your personal savings, or your psychological endurance runs out—whichever hits zero first.
To survive and scale without external capital, you must manage all three variables simultaneously. We call this the Survival Triad.
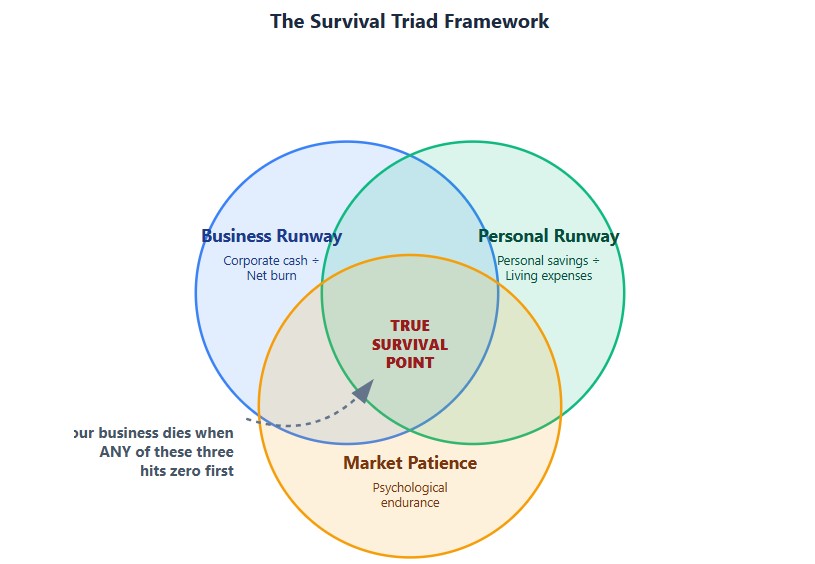
Layer 1: Business Runway (The Financial Clock)
This is the standard metric: Total Business Cash ÷ Net Monthly Burn. It tells you how long the company can operate at its current loss rate. However, bootstrappers often misinterpret this number by focusing too heavily on net burn while ignoring the structural risks of their gross burn.
Gross vs. Net Burn and the Reinvestment Trap
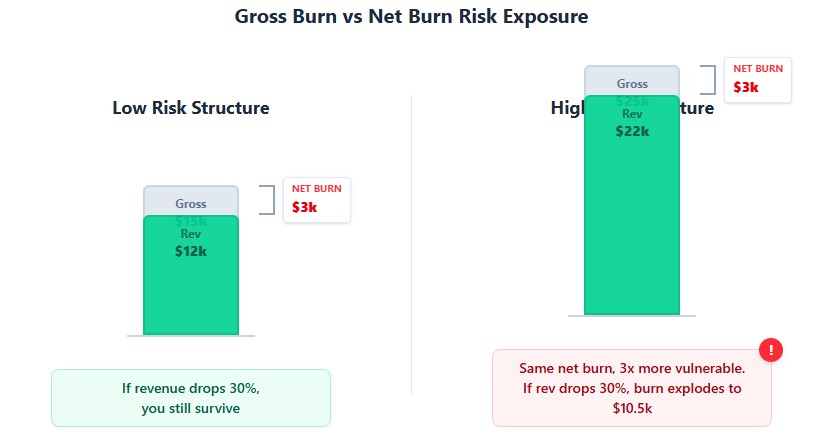
Gross burn is your total fixed monthly outflow (salaries, rent, core software). Net burn is your gross burn minus your monthly revenue.
Bootstrappers obsess over net burn because it looks better on a spreadsheet. But gross burn is what kills you during a revenue dip. If your gross burn is $20,000 a month and a major client churns, you still owe $20,000 next month. To maintain cash sustainability, your fixed gross burn must remain as low as operationally possible. Variable costs (like ad spend, contractor fees, or server overages) should only scale in direct proportion to confirmed revenue.
The Bootstrapper’s Burn Multiple
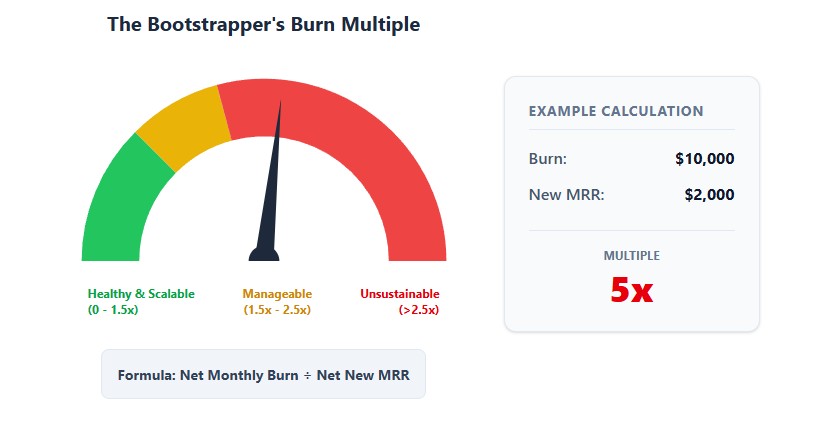
Venture capitalists use Burn Multiple to measure capital efficiency. For bootstrappers, it is the ultimate reality check on growth quality.
- Formula: Net Monthly Cash Burn ÷ Net New Monthly Recurring Revenue (MRR).
- The Benchmark: If you burn $10,000 to generate $2,000 in new MRR, your multiple is 5x. You are paying $5 to buy $1 of recurring revenue. A sustainable bootstrapped multiple is under 2x, trending toward 1x as you achieve product-market fit.
Layer 2: Personal Runway (The Oxygen Supply)
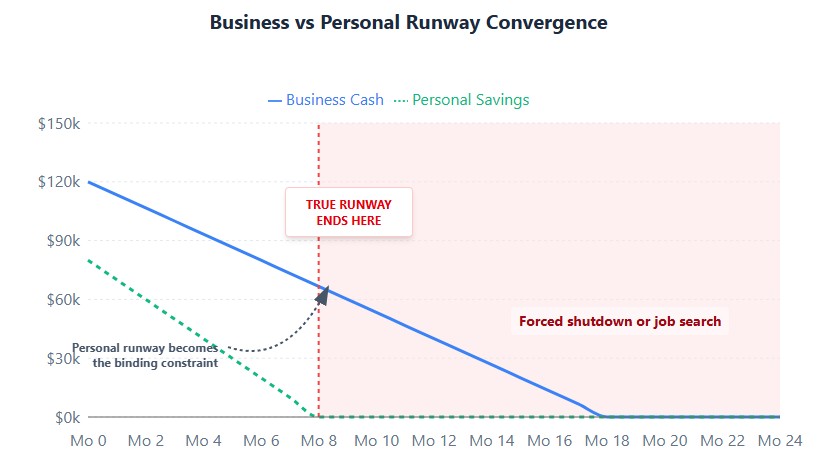
If your LLC has 18 months of runway, but your personal savings will run out in 4 months because you are taking a $0 salary, your actual business runway is 4 months. You will be forced to shut down or take a full-time job long before the corporate account hits zero.
Defining the Walk-Away Number
Before you launch—or if you are already in the trenches—you must define your Walk-Away Number. This is the exact dollar amount in your personal, liquid savings that, if reached, triggers an immediate shutdown of the business.
Bootstrappers frequently fall into the sunk-cost fallacy, draining their retirement accounts or taking on high-interest personal debt to keep a failing concept alive. Treating your personal financial floor as a hard, non-negotiable constraint is the most critical risk management strategy you possess. If your personal runway drops below 6 months, your business strategy must immediately shift from growth to cash preservation.
Layer 3: Market Patience (The Psychological Clock)
This is the metric no one talks about, yet it dictates more startup deaths than cash flow. Market Patience Runway is the number of months you can endure low growth, high friction, and market rejection before you burn out or lose conviction in the product.
You might have two years of cash in the bank, but if you have spent 14 months trying to sell a B2B tool to an unresponsive market, your psychological endurance is likely depleting faster than your bank balance.
- Measuring Patience: Track your weekly enthusiasm and decision-making quality. Are you delaying critical pivots because you are exhausted? Are you ignoring negative customer feedback because you just want to “make it work”?
- Extending Patience: You extend this runway by securing small, undeniable wins. Landing three highly engaged design partners does more for your psychological runway than 1,000 passive email subscribers.
Tactical Levers to Engineer Cash Flow
When the Survival Triad indicates pressure, you cannot call an investor. You must pull operational levers to alter the math.
Lever 1: Negative Working Capital via Annual Prepayment
If you sell software, retainers, or physical goods, offer a significant discount (e.g., 20%) for annual upfront payments. You sacrifice a portion of your total margin, but you acquire 12 months of cash immediately. You are effectively securing an interest-free loan from your customers to fund your operations.
Lever 2: Aggressive Vendor Financing
Stop paying for services upfront. Negotiate Net-30 or Net-60 terms with your agencies, suppliers, and software vendors. If you can collect cash from your customers in 15 days but pay your vendors in 60 days, you create a permanent, self-sustaining cash buffer.
Lever 3: Pre-Selling the Roadmap
Do not build features in the dark. Sell the solution before you code it. If your existing customer base will not pre-pay or sign a binding Letter of Intent (LOI) for your next major release, the market is telling you not to build it. Let customer cash dictate your product roadmap, not your assumptions.
The Operator’s Decision Matrix: Pivot, Persevere, or Shut Down
How do you know when to change course? Bootstrappers need a multi-dimensional framework to evaluate their position, moving beyond simple cash balances to assess structural business health.
| Scenario | Burn Multiple | Customer Concentration | Founder Salary Status | Churn / Retention | Action Plan |
|---|---|---|---|---|---|
| The Traction Trap | > 3x | Low volume, high effort | Deferring indefinitely | High (>8% monthly) | Hard Pivot or Shutdown. The market is rejecting the value proposition. Stop spending and rethink the core offer. |
| The Slow Grind | 1.5x – 3x | Moderate, stable | Partial draw | Stable (3-5% monthly) | Optimize & Extend. Cut gross burn, push annual pre-pays, and focus entirely on high-intent, low-CAC channels. |
| Escape Velocity | < 1.5x | Diversified, growing | Market rate achieved | Low (<2% monthly) | Scale Variable Costs. Unit economics are proven. Reinvest profits into paid acquisition or hire key operators. |
The 30-Day Cash Sustainability Audit
Execute this audit to bring your Survival Triad into focus and secure your operational baseline.
- Week 1: Map the Triad. Calculate your exact Business Runway, Personal Runway, and assess your current Market Patience. Identify which of the three is your most immediate bottleneck.
- Week 2: Audit Gross Burn. Review every fixed expense. If a subscription or contractor does not directly contribute to server stability or revenue generation, cancel it.
- Week 3: The Pre-Pay Push. Reach out to your top 20% of most satisfied customers with an exclusive annual pre-pay offer to generate an immediate cash infusion.
- Week 4: Renegotiate Terms. Contact your top three vendors and request extended payment windows (Net-30 or Net-60) to improve your working capital cycle.
Bootstrapping is not about deprivation; it is about relentless financial engineering. By managing your business capital, personal endurance, and psychological patience as a unified system, you build a company that survives the early years and ultimately belongs entirely to you.
