1. Executive Summary: The Financial Pitch
This is the only section some investors will read. Seriously. They’re busy, they see fifty decks a week, and they’re trained to spot vagueness. Your job here is to answer four questions in under 150 words: What is the legal entity? What do you sell and to whom? How much capital do you need and in what form? What are the hard financial targets for Year 1?
Pro Tip: Write this section last. You can’t summarize what you haven’t calculated. And never, ever use words like “passion,” “disrupt,” or “ecosystem” here. Save the brand voice for your website. This is a financial document.
What Investors Scan For (in order)
- Legal structure and jurisdiction (LLC? C-Corp? Where registered?)
- Capital ask amount and instrument (equity, convertible note, SAFE)
- Use of funds broken into 3-4 buckets with percentages
- Year 1 revenue target and projected net margin
- Exit hint or ROI timeline (even if rough)
Concrete Example: Petal & Stem Floral Executive Summary
| Field |
Value |
Why It Matters |
| Company |
Petal & Stem Floral, LLC |
Clear legal identity. Wyoming registration signals asset protection intent. |
| Physical Nexus |
Austin, TX (cold-storage fulfillment warehouse) |
Triggers Texas sales tax obligations. Shows you understand nexus rules. |
| Business Model |
D2C Hybrid: High-margin perishables (fresh florals) + botanical decor |
Clarifies revenue drivers. “Hybrid” signals multiple monetization paths. |
| Funding Ask |
$75,000 via Convertible Note (20% discount, $500k cap) |
Specific instrument. Shows you’ve talked to lawyers or advisors. |
| Use of Funds |
40% Inventory, 35% CAC, 25% Working Capital |
Money goes to revenue-generating activities, not “salaries” or “office”. |
| Year 1 Target |
$250,000 Gross Revenue, 12% Net Margin |
Conservative, defensible number. Not “we’ll do $2M because viral”. |
| ROI Signal |
Projected 3.2x return on seed at Year 3 exit or refinancing |
Gives investors a hook. Doesn’t overpromise. |
 Commentary:
 Notice there’s no story about “why we love flowers.” That’s for your About page. Here, every line either reduces perceived risk or increases perceived return. That’s the only job of the Executive Summary.
2. Company Description & Legal Structure
US investors care about two things when they read this section: liability exposure and tax complexity. If your legal structure is vague, they assume you haven’t thought about risk. If you ignore nexus rules, they assume you’ll get hit with a surprise tax bill in 18 months. This section is your chance to show you’ve done the boring homework.
Micro-Guide: Nexus Checklist for E-commerce
1. Where is your LLC formed? (Wyoming, Delaware, etc.)
2. Where do you store inventory? (Triggers physical nexus)
3. Where do you have employees or contractors? (Triggers payroll tax obligations)
4. Where do you exceed economic nexus thresholds? (Usually $100k revenue or 200 transactions in a state)
5. Do you sell regulated goods? (Food, plants, alcohol = extra permits)
Concrete Example: Petal & Stem Floral Legal Breakdown
Petal & Stem Floral is structured as a Single-Member LLC formed in Wyoming. We chose Wyoming for its strong charging order protection, which helps shield personal assets from business liabilities. However, because we store inventory and fulfill orders from a leased cold-storage warehouse in Austin, Texas, we have registered as a Foreign LLC in Texas and obtained a Texas Sales and Use Tax Permit.
Key Compliance Items:
- Texas Sales Tax Permit: We collect and remit sales tax on all orders shipped to Texas addresses. Automated via Shopify Tax.
- USDA APHIS & State Ag Regulations: We source cut flowers from licensed domestic and import growers. We maintain strict phytosanitary documentation and supplier audit trails to comply with interstate agricultural movement laws.
- Business Insurance: General Liability ($1M) + Product Liability ($1M) via Hiscox. Required by our warehouse lease and payment processors.
Gotcha: Many founders think “I’m just dropshipping, I don’t need permits.” Wrong. If you take payment from a customer in a state where you have nexus, you owe sales tax. Payment processors like Stripe will 1099-K you, and the state will come looking. Document your nexus position early.
3. Market Analysis (TAM, SAM, SOM) & Competitive Edge
Here’s where most plans blow up. Founders write: “The global floral market is $100B, we just need 0.1%!” Investors roll their eyes. That’s top-down thinking, and it’s useless for a bootstrapped D2C brand. Instead, use bottom-up math: start with the specific customer you can actually reach, then calculate how many of them exist, then estimate what % you can realistically convert.
Micro-Guide: Calculating SOM for Bootstrapped D2C
1. Define your narrowest viable niche (e.g., “HR managers at SaaS companies in Texas who send Q4 gifts”)
2. Estimate the number of target accounts (use LinkedIn Sales Navigator, Apollo, or industry reports)
3. Apply a conservative conversion rate based on your sales capacity (e.g., 2% of 500 accounts = 10 clients)
4. Multiply by average order value to get your Year 1 SOM
5. If your SOM is less than your revenue target, your plan is broken. Fix the math or the model.
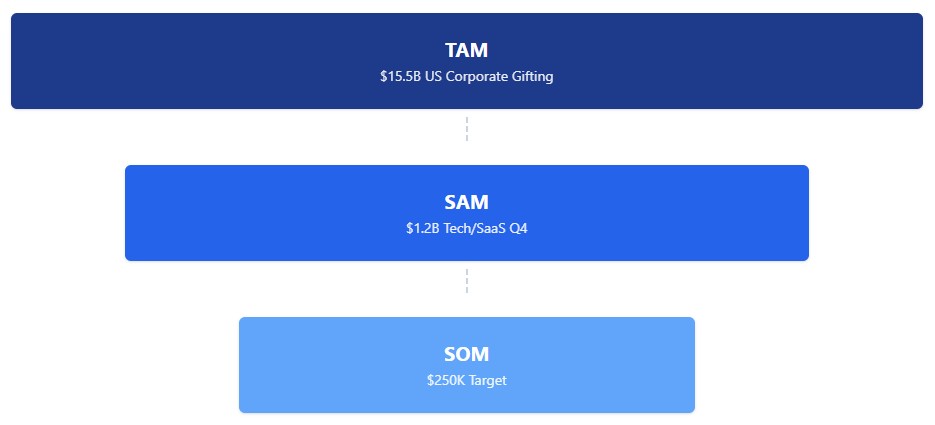
Concrete Example: Petal & Stem Floral Market Sizing
| Metric |
Calculation Logic |
Value |
| TAM
Total Addressable Market |
US Corporate Gifting Market (IBISWorld 2024) |
$15.5 Billion |
| SAM
Serviceable Available Market |
TAM x % spent on “premium experiential gifts” x % in tech/SaaS verticals x % in our 5 target states
$15.5B x 8% x 12% x 6.5% |
$1.2 Billion |
| SOM
Serviceable Obtainable Market (Year 1) |
SAM x % we can reach via outbound sales capacity
500 target accounts x 2% conversion x $2,500 avg order |
$250,000 |
 Competitive Edge (Not “We’re Better”):
- Hybrid SKU Moat: Most corporate gifting vendors do cheap grocery-store bouquets OR hard gifts. We do premium, designer floral arrangements + high-end ceramic vases in one box, increasing perceived value and reducing vendor fragmentation for the buyer.
- Micro-Fulfillment Speed: Same-day shipping cutoff at 2 PM CST vs. industry standard 24-48 hours. Critical for perishable cut flowers.
- B2B-First Pricing: Volume discounts baked into our COGS model, allowing 40% margin even at wholesale pricing. Most D2C florists can’t pivot to B2B without rebuilding their unit economics.
Reality Check: Your SOM should feel uncomfortably small. If it doesn’t, you’re not being specific enough. It’s better to under-promise and over-deliver than to chase a fantasy number.
4. Organization & Management Team
Investors don’t expect a full org chart for a seed-stage company. They do expect you to show you’ve thought about labor costs, compliance, and scalability. The biggest mistake founders make here is listing “Founder salary: $80k” in Year 1. That’s a red flag. Show a lean, fractional model that preserves cash.
Pro Tip: Use “draw-only” compensation for founders in Year 1. It signals commitment and reduces burn. Document it in your operating agreement so investors know you’re not taking cash out before profitability.
Concrete Example: Petal & Stem Floral Lean Team Structure
| Role |
Structure |
Monthly Cost |
Notes |
| Founder/CEO |
Full-time, draw-only |
$0 (Year 1) |
Draws begin at Month 7 if net margin >10% for 2 consecutive months. |
| Fractional CFO |
Contractor, 10 hrs/month |
$800 |
Handles bookkeeping (QuickBooks Online), sales tax filings, cash flow forecasting. Retained via Upwork with 30-day termination clause. |
| Floral Fulfillment Associate |
Part-time W-2, 20 hrs/week |
$1,560 |
$18/hr + 7.65% payroll tax. Scales to 40 hrs when orders exceed 15/day. |
| Customer Support |
Outsourced to specialized e-commerce VA |
$400 |
10 hrs/week via Belay. Handles email/ticketing. Escalates complex issues to Founder. |
| Legal/Compliance |
As-needed retainer |
$150 avg |
Local business attorney on $500/mo retainer with unused hours rolling quarterly. |
| Total Monthly Payroll |
|
$2,910 |
Excludes founder draw. Scales with revenue triggers. |
Commentary: This structure keeps fixed labor costs under $3k/month while covering critical functions. The fractional CFO is non-negotiable—sales tax errors can bankrupt a small e-commerce brand. The W-2 employee ensures we control floral prep and packing quality. Everything else is outsourced or handled by the founder.
5. Product Line, Sourcing & Unit Economics
This is where you prove you understand margins. Not “we make 60% margin” hand-waving. Actual, line-item COGS that includes every physical cost to get a product into a customer’s hands. If you miss shrinkage, packaging, or payment processing fees, your “profit” is imaginary.
Micro-Guide: Stripping COGS to the Bone
1. Start with wholesale product cost
2. Add inbound freight (per unit allocation)
3. Add packaging: box, void fill, tape, label, insert
4. Add shrinkage allowance (3-5% for perishables, 1-2% for dry goods)
5. Add payment processing fee (2.9% + $0.30 for Stripe/Shopify Payments)
6. Add pick/pack labor cost (if not using 3PL)
7. That’s your true Landed COGS. Anything less is fantasy.
Concrete Example: “The Executive Arrangement” Unit Economics
| Cost Component |
Amount |
Calculation Notes |
| MSRP (Retail Price) |
$65.00 |
Final price to consumer, before tax/shipping. |
| Premium Floral Stems (wholesale) |
$12.05 |
Direct from farm, tier-2 pricing at 100+ units/month. |
| Ceramic Vase + Floral Mechanics |
$8.50 |
Bulk order, includes heavy-duty vase and hydration foam/water tubes. |
| Corrugated Box (12x12x6) |
$1.85 |
Custom printed, 500-unit MOQ. |
| Custom Void Fill + Hydration Insert |
$1.30 |
Molded pulp insert to secure vase + moisture-lock bag. |
| Shipping Label + Packing Tape |
$0.45 |
Thermal label + 2″ tape allocation. |
| Shrinkage Allowance (3%) |
$0.70 |
Buffer for floral wilt, stem damage, returns. |
| Payment Processing (2.9% + $0.30) |
$2.19 |
Stripe fee on $65 transaction. |
| Total Landed COGS |
$27.04 |
Cost to fulfill one order, excluding outbound shipping. |
| Gross Profit |
$37.96 |
MSRP – COGS = 58.4% margin. |
| Outbound Shipping (Customer Paid) |
$0.00 |
Charged to customer at checkout. Not part of COGS. |
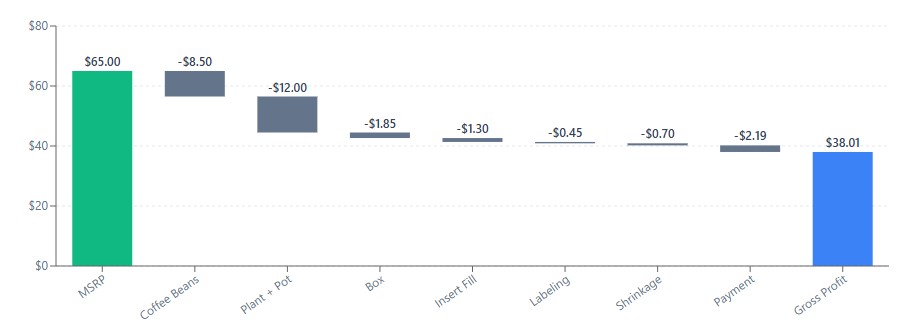 Key Insight:
 Our gross margin is 58.4%, not the 62.5% we’d have if we ignored payment fees and shrinkage. That 4% difference is the margin between profit and loss at scale. Always model the worst-case COGS, then be pleasantly surprised when reality is better.
6. Operations, Fulfillment & Supply Chain Logistics
Most e-commerce founders outsource fulfillment too early. For hybrid SKUs with perishables, that’s a mistake. Standard 3PLs aren’t set up for fresh cut flowers. You’ll get wilted product, snapped stems, and angry customers. Start with a micro-fulfillment center you control. Scale to 3PL only after you’ve documented every SOP.
Pro Tip: Your SLA (Service Level Agreement) with yourself is more important than any customer-facing promise. If you can’t consistently prep and pack orders in under 4 hours, don’t promise same-day shipping. Under-promise, over-deliver.
Concrete Example: Petal & Stem Floral Fulfillment Protocol
Facility: 500 sq. ft. climate-controlled cold storage unit in Austin, TX. $1,500/month including utilities. Zoned for light industrial use.
Workflow:
- Order received via Shopify before 2:00 PM CST
- Picker prints batch pick list via ShipStation
- Stems pulled from cold storage, hydrated, and arranged with mechanics
- Packed with custom insert, void fill, and temperature-appropriate materials (heat pack if <40°F)
- Label printed, package weighed, tracking uploaded automatically
- USPS Priority Mail pickup at 4:30 PM daily
Key Metrics:
- Order Accuracy: 99.2% target (scan-to-pack verification)
- Floral Mortality/Wilt Rate: <2% target (via hydration tech + carrier selection)
- Avg. Pack Time: 8 minutes/unit (benchmark for labor planning)
- Carrier Mix: 95% USPS Priority (2-3 day), 5% UPS Ground (heavy/bulk orders)
Why Not a 3PL (Yet): We tested two major 3PLs. Both had >5% damage/wilt rates for fresh florals due to extended dwell time in non-climate-controlled zones. Until we can document a floral-safe SOP that a 3PL can replicate, we keep fulfillment in-house. The $1,500/month rent is cheaper than 50 refunds.
7. Marketing, Sales & Customer Acquisition Strategy
Forget “brand awareness” and “social media engagement.” Those are vanity metrics. Investors want to see a repeatable, scalable acquisition channel with a known CAC and LTV. For B2B-heavy models like ours, that means outbound sales. For pure D2C, it means paid ads with clear ROAS. Pick one lane and master it before adding channels.
Micro-Guide: Calculating Real CAC
1. Pick one channel (e.g., LinkedIn outbound)
2. Track all costs: tool subscriptions, ad spend, labor hours (at $25/hr burdened rate)
3. Divide total spend by number of paying customers acquired in that period
4. If CAC > 33% of LTV, the channel is unsustainable. Kill it or fix it.
5. Never blend CAC across channels until each is profitable alone.
Concrete Example: Petal & Stem Floral B2B Outbound Funnel
Channel: LinkedIn + Email outreach via Apollo.io
Target Persona: HR Directors or Office Managers at SaaS companies with 50-200 employees in Texas, California, and New York.
Funnel Metrics (Monthly Targets):
| Stage |
Volume |
Conversion Rate |
Output |
| Outreach Sent |
1,000 contacts |
– |
1,000 |
| Replies |
– |
25% |
250 |
| Meetings Booked |
– |
20% of replies |
50 |
| Proposals Sent |
– |
80% of meetings |
40 |
| Deals Closed |
– |
25% of proposals |
10 |
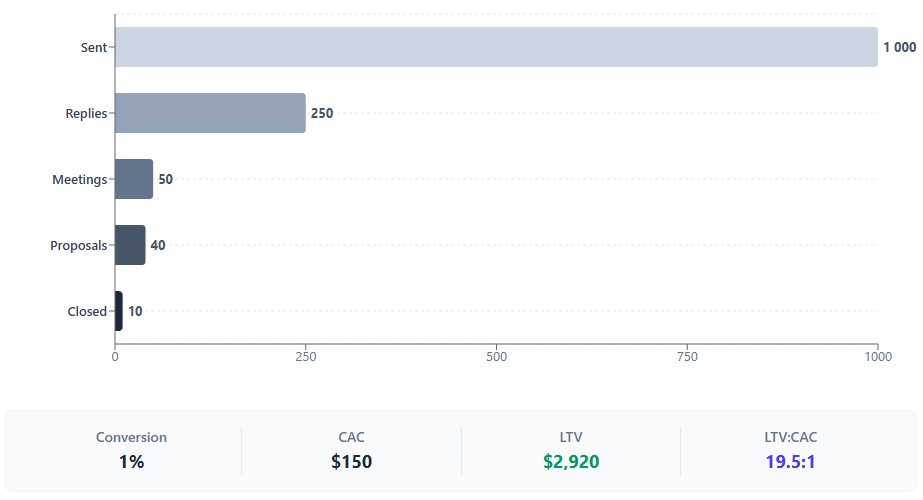 Economics:
- Monthly Channel Cost: $1,500 (Apollo.io $99 + Founder time 40 hrs @ $25/hr + design/assets $200)
- Customers Acquired: 10
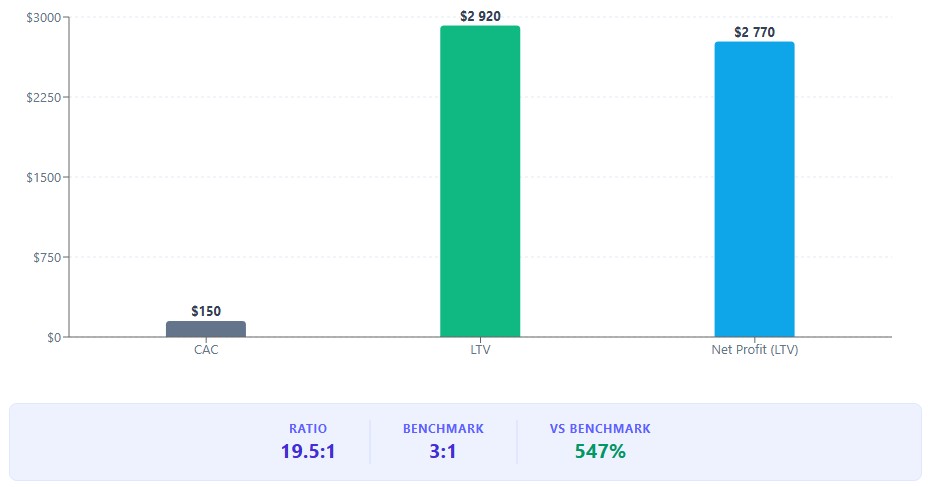
- CAC: $1,500 / 10 = $150 per client
- Avg. Order Value: $2,500 (corporate bulk order)
- Gross Profit per Order: $2,500 x 58.4% = $1,460
- LTV (12 months): $2,500 x 2 orders/year = $5,000 revenue → $2,920 gross profit
- LTV:CAC Ratio: $2,920 / $150 = 19.5:1
Reality Check: A 19.5:1 LTV:CAC looks too good. That’s because we’re using conservative conversion rates and including founder labor in CAC. Most founders exclude their own time, which inflates ROI. Don’t do that. If the math still works with honest inputs, you have a real business.
8. Risk Management & Mitigation
Every business has fatal flaws. The question isn’t “if” something will go wrong, but “when” and “how bad.” Investors want to see that you’ve thought about the worst-case scenarios and have plans to limit damage. This section isn’t about being negative—it’s about being prepared.
Pro Tip: List risks in order of probability x impact. A low-probability, high-impact risk (warehouse fire) needs insurance. A high-probability, medium-impact risk (chargebacks) needs process fixes. Address both.
Concrete Example: Petal & Stem Floral Risk Matrix
| Risk |
Probability |
Impact |
Mitigation |
Owner |
| Payment Gateway Hold
Stripe/Shopify Payments freezes funds due to >1% chargeback ratio |
Medium |
High |
1) Use Route package protection to shift refund liability
2) Custom packaging inserts to reduce damage
3) Weekly chargeback monitoring; pause ads if ratio >0.7%
4) Maintain backup merchant account (PayPal) for continuity |
Founder |
| Floral Mortality Spike
Weather event or carrier delay causes >5% wilt/damage |
Low-Medium |
Medium |
1) Switch to hardy varieties (e.g., orchids, alstroemeria) during extreme weather
2) Use hydration gel/water tubes universally
3) Pre-emptive email to customers during weather alerts
4) Budget 3% shrinkage allowance in COGS |
Ops Lead |
| Stem Price Surge
Valentine’s/Mother’s Day supply chain disruption increases stem costs by 20%+ |
Low |
Medium |
1) 6-month forward contracts with growers locking volume/price
2) Dual-source stems (Domestic + South America)
3) Price adjustment clause in B2B contracts for >15% COGS increase |
Founder + CFO |
| Key Person Risk
Founder incapacitated, no one can fulfill orders |
Low |
High |
1) Document all SOPs in Notion
2) Cross-train part-time employee on floral prep and packing
3) Maintain “emergency fulfillment” contact with local 3PL for short-term overflow |
Founder |
Commentary: Notice each mitigation has an owner and a trigger. “We’ll be careful” isn’t a mitigation. “We monitor chargebacks weekly and pause ads at 0.7%” is. Specificity builds trust.
9. Funding Request & Detailed Use of Funds
This isn’t a wish list. Every dollar requested should have a direct line to revenue generation or risk reduction. Investors will scrutinize this table more than any other. If you allocate 30% to “salaries” in Year 1, expect tough questions. If you allocate 75% to inventory and CAC, expect nods.
Micro-Guide: Justifying Every Line Item
For each expense category, be ready to answer:
1) How does this drive revenue or reduce risk?
2) What happens if we cut this by 50%?
3) When does this expense scale up or down?
If you can’t answer all three, the item doesn’t belong in the plan.
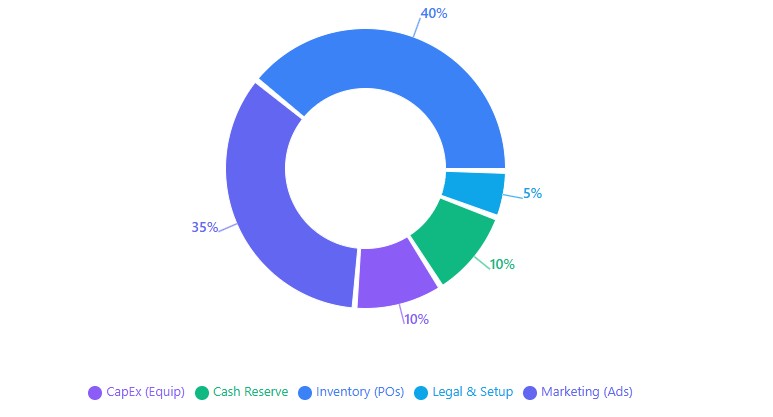
Concrete Example: Petal & Stem Floral Capital Allocation
| Category |
Amount |
% |
Revenue/Risk Link |
Scaling Trigger |
| Inventory (Initial POs) |
$30,000 |
40% |
Direct revenue driver. Enables tier-2 wholesale pricing (15% COGS reduction). |
Reorder when inventory turns <30 days. |
| Marketing (CAC) |
$26,250 |
35% |
Direct revenue driver. Funds 6 months of outbound tools + ad spend to hit SOM target. |
Scale spend when CAC <33% of LTV for 2 consecutive months. |
| CapEx (Warehouse) |
$7,500 |
10% |
Risk reduction. Thermal printers, floral prep stations, shelving reduce errors and labor time. |
One-time purchase. No scaling. |
| Legal/Licensing |
$3,750 |
5% |
Risk reduction. Trademark filing prevents brand infringement. Contract review avoids liability gaps. |
One-time setup + $150/mo retainer ongoing. |
| Working Capital Buffer |
$7,500 |
10% |
Risk reduction. Covers Q1 operational deficits while revenue ramps. |
Replenish when cash reserve <1 month of OpEx. |
| Total |
$75,000 |
100% |
|
|
Key Insight: 75% of funds go directly to revenue generation (inventory + marketing). The remaining 25% is split between one-time setup costs and a small buffer. This allocation signals discipline. If you need more than 10% for “miscellaneous,” your planning is too vague.
10. Financial Projections (The Core Metrics)
Forget 5-year hockey stick projections. No one believes them. Focus on the next 12-18 months with monthly granularity. The single most important metric: your break-even point in units. This tells you exactly how many boxes you must sell to cover fixed costs. Everything else is commentary.
Micro-Guide: Break-Even That Actually Works
1. List all fixed monthly costs (rent, software, insurance, base labor)
2. Calculate average gross profit per unit (MSRP – Landed COGS)
3. Divide fixed costs by gross profit per unit
4. That’s your break-even volume. If it’s >30 units/day for a new D2C brand, your model is too heavy. Simplify.
Concrete Example: Petal & Stem Floral Break-Even Analysis
Fixed Monthly Costs (OpEx):
- Warehouse Rent: $1,500
- Software Stack (Shopify, ShipStation, Apollo, QuickBooks): $300
- Insurance (General + Product Liability): $100
- Part-time Labor Base (20 hrs/week): $1,560
- Fractional CFO: $800
- Customer Support VA: $400
- Miscellaneous (bank fees, office supplies): $800
Total Fixed OpEx: $4,200/month
Variable Economics:
- Average MSRP: $65.00
- Landed COGS: $27.04
- Gross Profit per Unit: $37.96
Break-Even Formula:
Fixed Costs ÷ Gross Profit per Unit = Units Needed
$4,200 ÷ $37.96 = 110.6 units/month
Rounded up: 111 units/month or 3.7 units/day
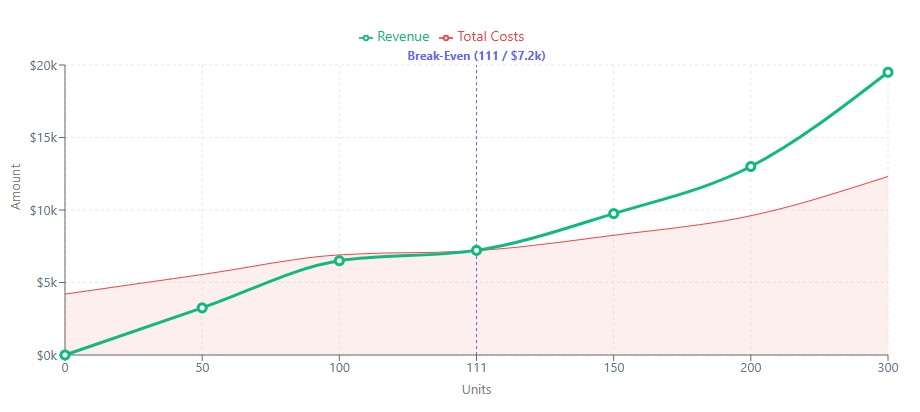 Interpretation:
 We need to sell 4 boxes per day to cover all fixed costs. After that, every sale contributes directly to profit. At our target SOM of $250k/year (~32 units/day average), we clear break-even by Week 3 of Month 2. This low barrier is intentional—it de-risks the investment and allows us to reinvest surplus cash into growth.
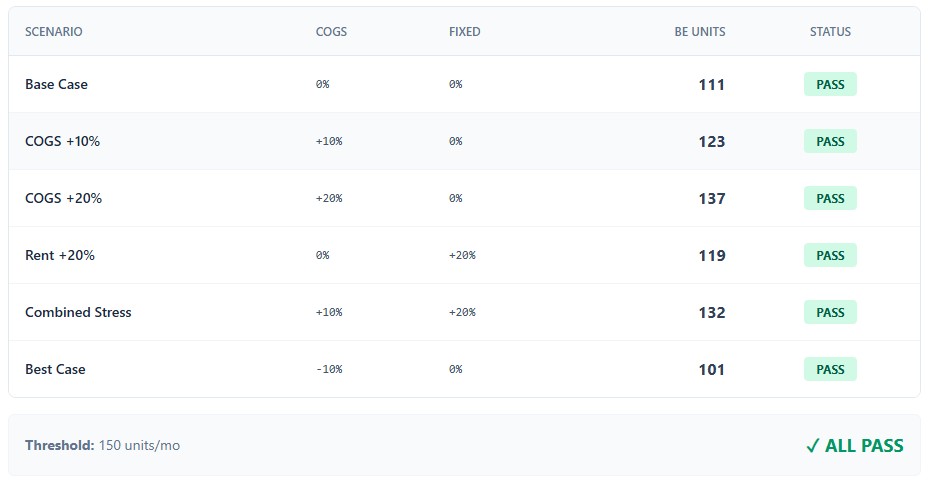
 Sensitivity Check:
 What if COGS rises 10%? Gross profit drops to $34.26. Break-even becomes 123 units/month (4.1/day). Still achievable. What if rent increases 20%? Fixed costs rise to $4,500. Break-even: 119 units/month (4/day). The model holds. That’s resilience.
This article uses publicly available data and reputable industry resources, including: