Here’s an uncomfortable truth: most commercial contractors don’t know their real profit margins until months after a project closes. By then, it’s too late to fix anything.
You might think you’re making 8% on that $3M office build-out. But after allocating equipment downtime, PM overtime, and the three change orders you never billed, you’re actually down 2%. This isn’t a math problem—it’s a systems problem.
In 2026, the contractors pulling 12-15% net margins aren’t working harder. They’re measuring differently, pricing smarter, using technology their competitors ignore, and—critically—understanding how regional differences impact profitability. A job in NYC operates under completely different rules than one in Austin or Denver.
This guide breaks down exactly how they do it, with specific tactics you can implement this week.
The Real Problem: You’re Tracking Revenue, Not Profitability
Most contractors run their business like this:
- Win the job
- Track direct costs (materials, labor, subs)
- Hope what’s left covers overhead and profit
That’s backwards. The contractors winning in 2026 start with target profit, work backward to required margin, and build systems that protect it daily—not monthly.
The shift: Stop asking “Did we make money on this job?” Start asking “Are we making money right now on this job, and if not, what are we changing today?”
Strategy 1: Kill the “Overhead” Category (It’s Killing Your Margins)
Here’s what most contractors call overhead:
- Project manager salaries
- Superintendent time
- Equipment depreciation
- Site utilities and temp facilities
- Safety coordination
Wrong. These aren’t overhead. They’re job-specific costs that should be allocated directly to projects.
The fix: Implement activity-based costing (ABC). Track every hour of salaried staff time against specific jobs. Charge equipment by the hour, not by the month.
Regional Case Study: The $2M Job That Was Actually Losing Money (Austin, TX)
A mid-sized GC in Austin thought they were making 6% on a warehouse project. After implementing ABC:
| Cost Category | Before (Buried in Overhead) | After (Direct Job Cost) | Impact |
|---|---|---|---|
| PM Time (80% on job) | $0 | $64,000 | -3.2% margin |
| Superintendent (100%) | $0 | $85,000 | -4.25% margin |
| Crane/Equipment | $12,000 (flat monthly) | $31,000 (hourly actual) | -0.95% margin |
| Site Facilities + Texas Permit Fees | $0 | $23,000 | -1.15% margin |
| Real Margin | 6.0% | -3.55% | 9.55% variance |
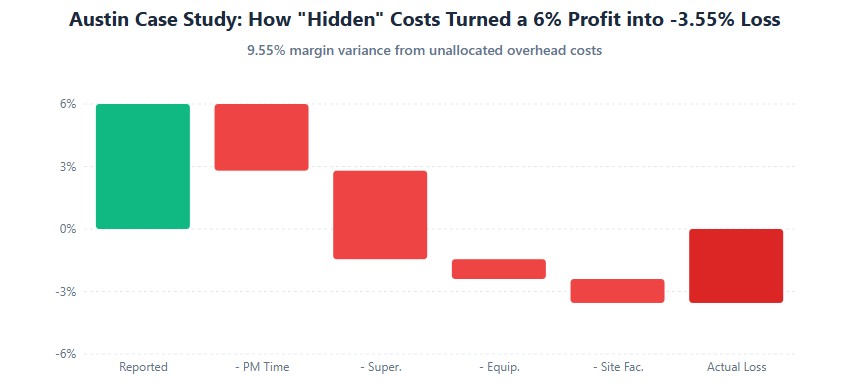
Regional factor: Texas has no state income tax but higher local permit fees and no prevailing wage requirements, which affects labor costing differently than NYC or California.
The lesson: That “profitable” job was actually losing $71,000. The company only survived because their cost-plus jobs were subsidizing their fixed-price work.
Implementation Checklist: Activity-Based Costing
- Week 1: Set up job codes in your accounting software (QuickBooks, Sage, or Autodesk Construction Cloud)
- Week 2: Implement time tracking for ALL salaried staff (not just field crews)
- Week 3: Install GPS hour meters on all major equipment
- Week 4: Run parallel reports (old method vs. ABC) to identify problem jobs
- Month 2: Adjust bidding formulas based on actual ABC data
Tools that work in 2026: Autodesk Construction Cloud (enterprise), Buildertrend (mid-market), or Raken (field-focused). Cost: $150-500/month, but pays for itself in one avoided cost overrun.
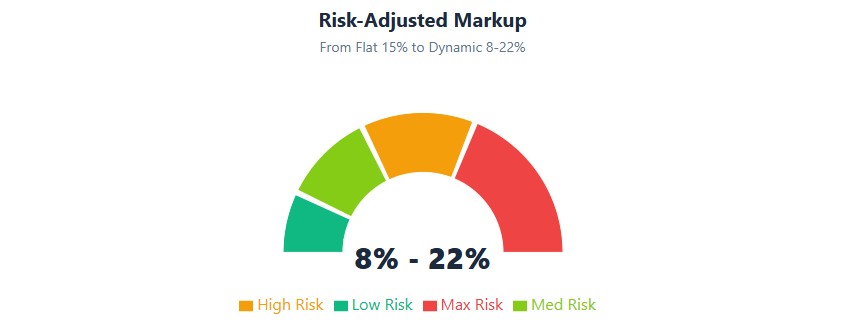
Strategy 2: Ditch Flat Markups—Use Risk-Adjusted Pricing with Regional Intelligence
Applying 15% markup to every job is like wearing the same size shoe regardless of your foot. It might work sometimes, but you’re guaranteed to limp on others.
The 2026 approach: Risk-adjusted markup based on four factors—plus regional variables.
The Risk Scoring Matrix (With Regional Adjustments)
| Risk Factor | Low Risk (+0-3%) | Medium Risk (+4-7%) | High Risk (+8-15%) |
|---|---|---|---|
| Client Payment History | Net-30, never late | Occasionally 15 days late | 60+ days, retainage disputes |
| Design Completeness | 100% CD set, no RFI expected | 75% complete, 20-30 RFIs expected | 50% complete, fast-track, 50+ RFIs |
| Permit Timeline (Regional) | Austin/Denver: 2-4 weeks | Midwest cities: 6-8 weeks | NYC/LA/Seattle: 4-8 months |
| Labor Availability (2026) | Denver: 5-8% shortage | Austin: 12-15% shortage | NYC/SF: 20-25% shortage |
| Tax Credit Availability | High (state incentives) | Moderate (federal only) | Low (complex compliance) |
Regional Case Study: How One GC Increased Win Rate AND Margins (Denver, CO)
A $50M/year GC in Denver was stuck at 4% net margins. They implemented risk-adjusted pricing with regional intelligence:
Before (Flat 12% Markup):
- Win rate: 35%
- Average margin: 4.2%
- Problem: Losing profitable jobs to low-ballers, winning risky jobs at thin margins
After (Risk-Adjusted 8-22% Markup with Regional Factors):
- Win rate: 42% (yes, it went UP)
- Average margin: 9.1%
- Result: More selective bidding, higher confidence in pricing, fewer change order disputes
Regional advantage: Denver’s moderate permit timelines (4-6 weeks) and growing labor pool allowed them to take on more complex projects with appropriate risk pricing, while competitors stuck to flat markups.
The key insight: When you price risk accurately—including regional factors like permit timelines and labor availability—you stop competing on price for dangerous jobs. Clients respect that. And you win more of the right jobs.
2026 Regional Risk Factors Most Contractors Ignore
- Supply chain volatility by region: West Coast ports add 5-10% escalation for steel/copper. Midwest has better access but longer lead times.
- Labor availability crisis: NYC/SF face 20-25% skilled labor shortages (add 8-12% for B-crew productivity). Denver/Austin at 12-15% shortage. Midwest at 5-8%.
- Permitting delays: NYC (6-10 months), LA (4-8 months), Seattle (5-7 months), Austin (2-4 weeks), Denver (4-6 weeks). Add 3-5% carrying costs for long-permit cities.
- State tax credits: California offers 15-30% energy efficiency credits. Texas has no state income tax but higher local fees. New York has brownfield remediation credits.
- Weather windows: Northern climates Q4 exterior work? Add 6-10% for weather delays. Southern regions: hurricane season buffers (June-November).
Strategy 3: Pre-Plan Change Orders (Don’t Just React)
Most contractors treat change orders as surprises. The profitable ones treat them as predictable events with financial buffers already built in.
The data: On commercial projects, 60-80% of change orders fall into predictable categories:
- Design gaps (“match existing” that doesn’t match)
- Site conditions (underground utilities, soil issues)
- Owner-requested upgrades (finish selections, tech upgrades)
- Code updates during construction
The Change Order Risk Register (Regional Version)
| Risk Category | NYC/Urban | Austin/Sunbelt | Denver/Mountain |
|---|---|---|---|
| Underground utilities | High (70%), $50-150K | Medium (40%), $15-40K | Low (25%), $10-25K |
| “Match existing” flooring | High (60%), $20-50K | Medium (50%), $8-20K | Medium (45%), $10-25K |
| Permit-driven changes | Very High (80%), $30-100K | Low (20%), $5-15K | Medium (35%), $10-30K |
| Weather delays | Medium (40%), $15-40K | Low (15%), $5-12K | High (55%), $20-60K |
Regional Case Study: Proactive Change Management (NYC)
A NYC GC working on a 15-story mixed-use building faced typical urban challenges: aging infrastructure, complex DOB requirements, and tight site logistics.
Their approach:
- Pre-construction GPR scan: Identified 12 undocumented utilities ($45K cost, but avoided $180K in change orders)
- DOB liaison: Hired expeditor for $15K, saved 6 weeks in permit delays ($85K in carrying costs)
- Early owner communication: “We found asbestos in the existing structure. We’ve budgeted $75K for abatement and have three certified vendors ready.”
Result: 11.2% net margin vs. industry average of 3-5% for NYC commercial projects.
Strategy 4: Value Engineering That Actually Makes Money (With Regional Incentives)
Most value engineering (VE) happens when the owner says “we’re over budget.” That’s too late. You’re already trapped in a low-margin job.
The 2026 approach: Front-load VE during preconstruction. Suggest alternatives that save the owner money and improve your margin—plus leverage regional tax incentives.
Regional Case Study: The $180K Win-Win (Denver, CO)
A GC was bidding a 40,000 sq ft medical office in Denver. The architect specified a curtain wall system at $2.1M.
The VE proposal:
- Alternative: Storefront system with high-performance glass
- Owner savings: $340K (16% reduction)
- Contractor benefit: $180K margin (volume discount from supplier + 2-week schedule compression)
- Colorado-specific bonus: Qualified for DOE commercial building energy incentives worth $45K
- Result: Won the job, owner got better value, GC made 10.5% instead of 4%
How they did it:
- Knew labor hours per system (curtain wall: 1,200 hrs vs. storefront: 800 hrs)
- Had strategic supplier relationship for volume pricing
- Understood schedule impact (storefront could be installed 2 weeks faster)
- Leveraged LEED v4.1 energy efficiency credits available in Colorado
- Presented it as total value, not just cost
Value Engineering Opportunities in 2026 (By Region)
| System | Traditional Spec | VE Alternative | Regional Incentive | Contractor Margin Boost |
|---|---|---|---|---|
| Exterior Walls | Curtain wall | Storefront + EIFS | CA: 15% energy credit | 8-12% (labor efficiency) |
| Flooring | Natural stone | Porcelain tile | TX: No state tax on materials | 6-10% (faster install) |
| HVAC | Traditional VAV | VRF system | NY: Brownfield remediation credit | 10-15% (specialty discount) |
| Lighting | Standard LED | Smart LED + controls | Federal: DOE incentives | 12-18% (rebate sharing) |
| Waste Management | Standard disposal | C&D recycling program | EPA C&D credits | 5-8% (disposal savings) |
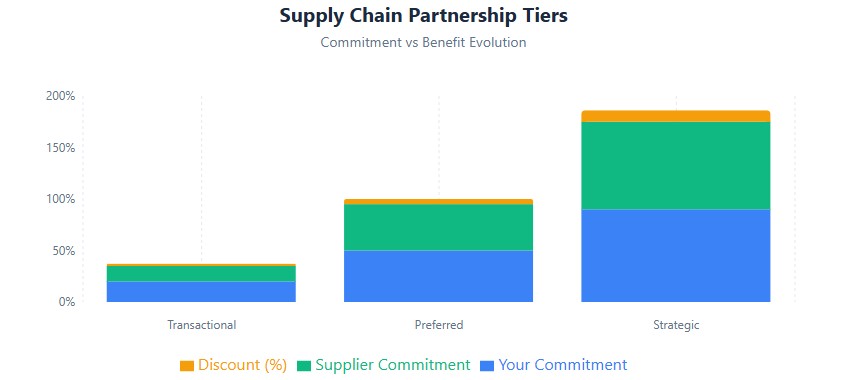
Strategy 5: Supply Chain Partnerships (Not Vendor Shopping)
Chasing the lowest price per unit is a race to the bottom. The profitable contractors in 2026 treat suppliers as partners, not adversaries.
The Three-Tier Partnership Model
| Tier | Your Commitment | Supplier Commitment | Your Profit Lever |
|---|---|---|---|
| Transactional | Project-by-project | Standard pricing | 1-3% discount |
| Preferred | Annual volume commitment ($500K+) | Priority allocation, 3-7% discount | Margin protection during shortages |
| Strategic | Multi-year, shared pipeline, JIT delivery | 7-15% discount, co-designed solutions | Competitive advantage, early access |
Regional Case Study: The Steel Partnership That Saved a Job (Austin, TX)
In Q2 2025, steel prices spiked 22% in 60 days. A GC with transactional suppliers got hammered. A GC with a strategic partner in Austin:
- Had locked pricing 6 months out
- Got 48-hour delivery when competitors waited 3 weeks
- Received early notice of price increases (adjusted change orders before competitors)
- Leveraged Texas’s central location for better logistics
- Result: Protected 8% margin while competitors lost 5%
How to Build Strategic Partnerships in 2026
- Share your pipeline: Show suppliers your next 12 months of work. They’ll prioritize you.
- Commit to volume: “We’ll spend $750K/year with you if you give us 7% discount and 48-hour delivery.”
- Pay faster: Net-15 instead of Net-30 for an additional 2% discount.
- Give feedback: Tell suppliers what’s working and what’s not. They’ll customize solutions.
- Use technology: Integrate your estimating software with their inventory systems (Autodesk Construction Cloud, Procore).
- Regional advantage: In Texas, leverage proximity to steel mills. In NYC, partner with suppliers who have Manhattan warehouse access.
Strategy 6: Track Earned Hours, Not Just Timecards
“My crew worked 40 hours this week.” That’s useless data.
“My crew earned 32 hours of productivity against 40 hours worked, with 8 hours lost to material delays.” That’s actionable intelligence.
The Earned Hours Formula
Earned Hours = Quantity Installed × Budget Hours per Unit
Example:
- Budget: 100 sheets of drywall @ 0.5 hours/sheet = 50 budget hours
- Actual: Crew worked 48 hours, installed 70 sheets
- Earned hours: 70 sheets × 0.5 hours = 35 earned hours
- Productivity: 35/48 = 73% efficiency
- Action needed: Investigate why crew is at 73% instead of 100%
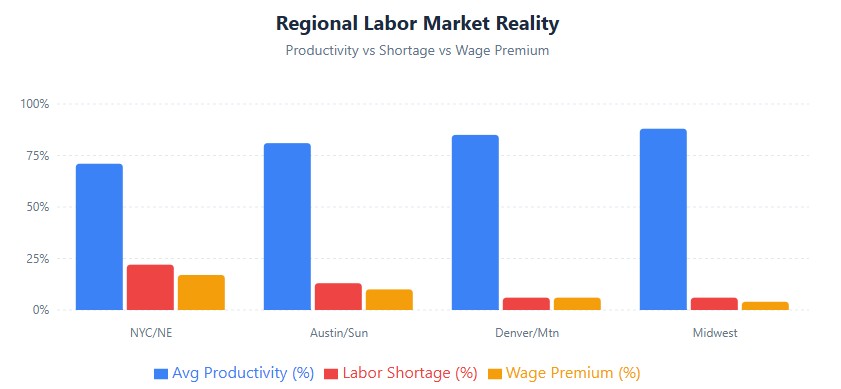
Regional Labor Productivity Differences (2026)
| Region | Avg. Productivity | Labor Shortage | Wage Premium | Adjustment Factor |
|---|---|---|---|---|
| NYC/Northeast | 68-75% | 20-25% | +15-20% | Add 12-15% to bids |
| Austin/Sunbelt | 78-85% | 12-15% | +8-12% | Add 6-9% to bids |
| Denver/Mountain | 82-88% | 5-8% | +5-8% | Add 3-6% to bids |
| Midwest | 85-92% | 5-8% | +3-6% | Add 2-4% to bids |
2026-Specific Profit Levers Most Contractors Ignore
1. AI-Powered Estimating
Tools like Autodesk Takeoff can:
- Reduce estimating time by 60%
- Improve accuracy by 15-20%
- Identify scope gaps before bidding
- ROI: $500/month software → $50K/year in avoided errors
2. Prefabrication and Modular Construction
For repetitive elements (bathrooms, MEP racks, wall panels):
- 30-50% labor cost reduction
- 40% schedule compression
- Higher quality control
- Regional advantage: Austin/Denver have growing prefab facilities. NYC has limited laydown space, making prefab essential.
- Catch: Requires upfront coordination and design freeze
3. Sustainability and ESG Premiums
LEED v4.1 and Net-Zero projects:
- Command 3-7% premium pricing
- Access to green financing (lower rates)
- Federal tax incentives: 15-30% of project cost
- EPA C&D debris management credits
- 2026 trend: 40% of commercial owners require sustainability certification
- Regional variation: California mandates Title 24 energy compliance. NYC has Local Law 97 carbon limits.
4. Workforce Development Credits
Federal and state programs:
- Work Opportunity Tax Credit (WOTC): $2,400-9,600 per eligible apprentice
- Apprenticeship tax credits: $2,000-5,000 per apprentice
- Training grants: 50-75% of training costs
- Example: 10 apprentices = $30K in credits + better retention
- Regional bonus: Texas offers additional state-level workforce development incentives. California has Cal Apprenticeship programs.
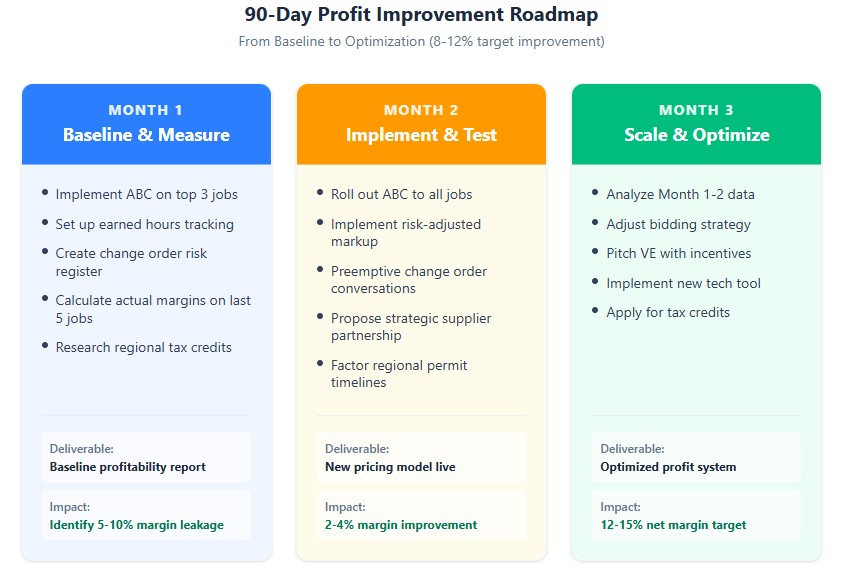
Your 90-Day Profit Improvement Plan (Regional Adaptation)
Month 1: Baseline and Measure
- Implement activity-based costing for your top 3 active jobs
- Set up earned hours tracking for one trade (start with drywall or concrete)
- Create a change order risk register with regional factors
- Calculate your actual margin on the last 5 completed jobs (not estimated, actual)
- Regional task: Research your state’s specific tax credits (DOE incentives, WOTC, state programs)
Month 2: Implement and Test
- Roll out ABC to all jobs
- Implement risk-adjusted markup on your next 3 bids (include regional factors)
- Have the “preemptive change order” conversation with your current client
- Identify one strategic supplier and propose a partnership
- Regional task: If in NYC/LA, factor in 6-10 month permit timelines. If in Austin/Denver, leverage faster approvals.
Month 3: Scale and Optimize
- Analyze Month 1-2 data: which jobs are actually profitable?
- Adjust your bidding strategy based on real data
- Pitch value engineering on your next preconstruction project (include LEED or energy incentives)
- Implement one new technology tool (start with Autodesk Takeoff or Raken)
- Regional task: Apply for available tax credits (WOTC, energy efficiency, C&D recycling)
The Bottom Line
Improving profit margins in 2026 isn’t about working harder or cutting corners. It’s about:
- Measuring differently (ABC, earned hours, not just revenue)
- Pricing smarter (risk-adjusted with regional intelligence, not flat markup)
- Planning proactively (change order buffers, VE before construction)
- Partnering strategically (suppliers, not vendors)
- Using technology (Autodesk Construction Cloud, AI, drones, productivity tracking)
- Leveraging regional advantages (tax credits, permit timelines, labor availability)
- Maximizing incentives (LEED, DOE incentives, WOTC, EPA C&D credits)
The contractors pulling 12-15% margins aren’t geniuses. They just stopped guessing and started measuring. They understand their regional market. They leverage available incentives. And they use technology to stay ahead.